Learn more
The Blueprint Behind Every Beautiful Store Display
Great visual merchandising doesn’t happen by chance — it’s carefully designed, mapped, and executed through a plan. In retail, that plan is called a visual merchandising planogram.
A visual merchandising planogram is more than just a layout of shelves — it’s the creative and strategic blueprint that connects a brand’s story to the shopper’s eye. It ensures that every product, prop, and sign sits exactly where it should, guiding customers through a seamless, visually engaging journey.
When done right, planograms turn shelf space into storytelling space. They help retailers maintain brand consistency, maximize product visibility, and influence buying behavior in subtle but powerful ways. But when ignored or poorly executed, even the most creative displays can fail to convert — leading to low engagement, misplaced SKUs, and missed sales opportunities.
In this guide, we’ll explore what a visual merchandising planogram is, how it’s built, and how the right technology can transform your visual displays into profit-driving brand experiences.
What Is a Visual Merchandising Planogram?
A visual merchandising planogram is a strategic visual layout that defines exactly how products, signage, and props should be placed within a retail space to create a consistent, attractive, and high-performing shopping experience.
Think of it as a store’s storytelling map. While a traditional planogram focuses on space and stock optimization, a visual merchandising planogram adds a creative dimension — aligning color, balance, lighting, and brand identity to evoke emotion and guide customer behavior.
It combines two critical retail disciplines:
- The science of planogramming → ensuring every inch of shelf space drives maximum ROI.
- The art of visual merchandising → turning that data-driven layout into an emotionally engaging experience.
In simple terms:
“A planogram makes the shelf efficient; a visual merchandising planogram makes it irresistible.”
From highlighting hero products at eye level to arranging complementary categories side by side, this tool helps retailers bridge the gap between operational efficiency and visual creativity — ensuring every display not only looks great but also sells better.
Key Elements of a Visual Merchandising Planogram
A powerful visual merchandising planogram isn’t just about where products go — it’s about how every element on the shelf works together to attract attention, guide discovery, and drive purchases. Below are the essential components that make up an effective visual planogram:
1. Product Facings and Placement
Facings determine how many units of a product are visible to the shopper. The right number of facings can make a product appear popular and easy to access.
- Goal: Balance visibility and inventory efficiency.
- Tip: Place top-performing SKUs at eye level — often called the “buy level.”
2. Fixture Types and Layouts
Different fixtures tell different stories. From gondolas and endcaps to mannequins, wall bays, and display tables, each plays a role in directing shopper flow.
- Goal: Align fixture type with the product’s emotional and functional appeal.
- Example: Luxury skincare fits best on sleek glass shelving, while casual footwear thrives on open racks.
3. Brand Blocking and Color Flow
Products should be grouped logically — by brand, color, or category — to make navigation intuitive and visually appealing.
- Goal: Ensure visual balance and harmony while reinforcing brand identity.
- Tip: Use color gradients or brand-block sections to make displays look cohesive.
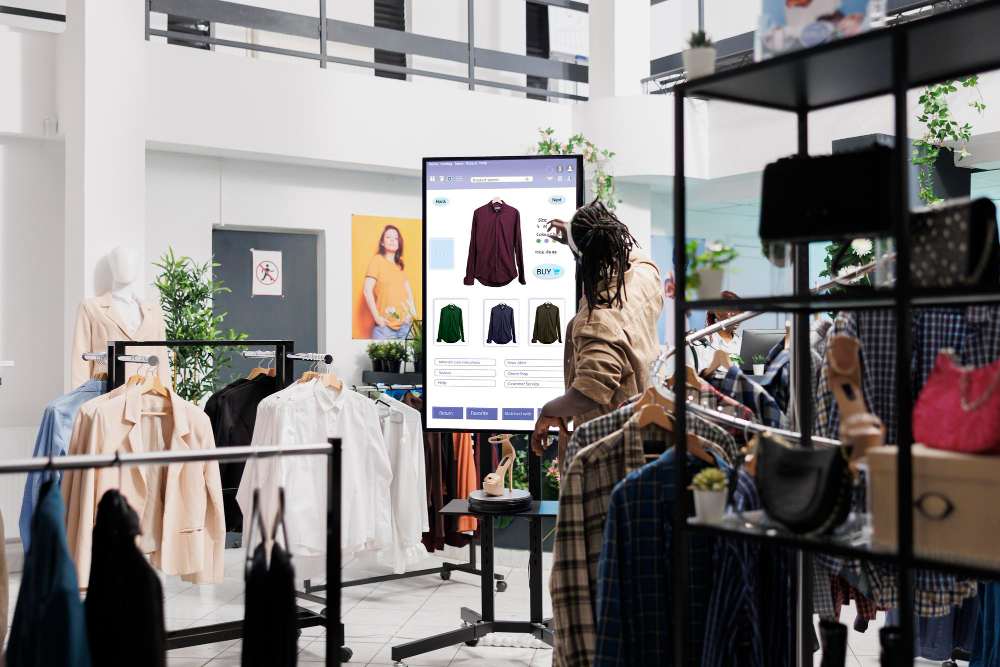
4. Signage and POP (Point of Purchase) Displays
Signage acts as a silent salesperson — educating, directing, and persuading shoppers. POP elements like banners or digital screens amplify promotions and call attention to featured products.
- Goal: Combine storytelling with clarity; too many signs can create clutter.
5. Eye-Level Zones and Hotspots
Not all areas of a display are equal. Eye-level and endcap zones are prime real estate. These “hot zones” are where shoppers naturally focus their attention.
- Goal: Use these areas for hero SKUs, seasonal products, or high-margin items.
When these elements are combined thoughtfully, a planogram transforms from a technical shelf diagram into a visual merchandising masterpiece — one that sells products, communicates brand value, and leaves a lasting impression on every shopper.
Why Visual Merchandising Planograms Matter
In today’s hyper-competitive retail world, visual impact is everything. Shoppers make split-second decisions — often within the first few seconds of walking into a store or glancing at a shelf. A well-crafted visual merchandising planogram ensures that those few seconds work in your favor.
Here’s why it’s indispensable for modern retailers:
1. Turns Shelf Space Into a Sales Engine
Planograms translate square footage into revenue. By placing the right products in the right place — informed by data and guided by design — retailers can maximize sales per square foot and improve category performance.
“Every inch of shelf space should earn its keep.”
2. Delivers a Consistent Brand Experience Across Stores
Whether you have 10 stores or 1,000, consistency matters. A visual merchandising planogram acts as a brand manual for your shelves — ensuring every outlet looks, feels, and sells like part of the same experience.
3. Enhances Customer Experience and Dwell Time
Visually balanced layouts help shoppers find what they need faster and discover products they didn’t plan to buy. This leads to increased dwell time and higher basket value — all while enhancing customer satisfaction.
4. Strengthens Supplier & Brand Collaboration
Planograms provide transparency. When suppliers can see how and where their products are displayed, it builds trust and accountability — especially for trade marketing campaigns and co-op displays.
5. Supports Data-Driven Merchandising Decisions
With digital planograms and analytics, visual merchandising isn’t guesswork anymore. Retailers can now test, measure, and refine layouts based on actual performance data — ensuring displays are not just beautiful, but profitable.
How to Create an Effective Visual Merchandising Planogram (Step-by-Step)
Building a visual merchandising planogram is part science, part storytelling. It’s not just about where products go — it’s about crafting a space that sells the story behind those products. Below is a simple, step-by-step approach that blends data, creativity, and practicality.
1. Start with Store and Shopper Insights
Before touching a single product image or shelf outline, understand your shoppers — who they are, how they move through your store, and what attracts their attention.
- Use data: Sales history, dwell time, heatmaps, and demographic insights.
- Goal: Build layouts that reflect how people actually shop, not how you assume they do.
2. Define the Objective of Each Display
Every display should have a clear intent — is it to promote new arrivals, cross-sell related items, or improve visibility for core SKUs?
- Example: An endcap display might aim for impulse purchases, while a central gondola highlights bestsellers.
- Goal: Match the planogram’s design to its commercial purpose.
3. Map Out the Fixture Layout and Flow
Sketch or digitally map your fixture types — shelves, racks, tables, walls, mannequins — and define the traffic flow.
- Tip: Use the “decompression zone” near store entrances for impactful first impressions.
- Goal: Ensure a logical flow from high-interest areas to complementary categories.
4. Allocate Products Strategically
This is where science meets aesthetics.
- High-margin or high-demand products: Eye level or endcaps.
- New arrivals or seasonal items: Front-facing or in “hot zones.”
- Complementary items: Grouped for cross-selling (e.g., chips + dips, shirts + ties).
- Goal: Drive visibility and spontaneous discovery.
5. Add Visual Storytelling Elements
Incorporate signage, lighting, textures, and props to make the planogram emotionally engaging.
- Example: Natural textures and warm lights for organic food sections.
- Goal: Transform functional layouts into experiences that spark curiosity and desire.
6. Review, Test, and Optimize
No planogram should be static. After rollout, analyze sales data and shopper behavior to see what’s working — and what’s not.
- Use analytics: Measure sales lift, compliance rates, and dwell time.
- Goal: Continuously refine layouts for maximum impact and profitability.
Common Mistakes to Avoid in Visual Merchandising Planograms
Even the most beautifully designed planograms can fail if execution or intent misses the mark. Many retailers invest time in creating layouts — but overlook the subtle details that make or break shelf performance. Here are some of the most common pitfalls to avoid when designing and implementing visual merchandising planograms:
1. Designing Without Data
Too many planograms are built on intuition instead of insight. Without sales data, shopper flow patterns, and inventory performance, retailers risk designing layouts that look good but don’t sell well.
- Avoid this by: Using data analytics to inform product placement and category flow.
2. Overcrowding the Shelf
A cluttered display overwhelms shoppers and hides key products. More items don’t always mean more sales — often, it means more confusion.
- Avoid this by: Leaving breathing space between product groups; let hero products shine.
3. Ignoring Shopper Eye Movement
If bestsellers or high-margin SKUs sit below the shopper’s natural sightline, you’re losing visibility and conversions.
- Avoid this by: Keeping your “buy level” at eye level — typically 4 to 5 feet from the floor.
4. Inconsistent Execution Across Stores
A perfect planogram at HQ often looks very different in real stores. Without consistent execution, brand experience suffers.
- Avoid this by: Using digital tools, photo validation, and real-time dashboards to track compliance.
5. Forgetting Seasonal and Regional Adaptations
A one-size-fits-all layout doesn’t work everywhere. Shopper behavior varies by region, climate, and culture.
- Avoid this by: Localizing planograms using performance data and regional sales trends.
6. Treating Planograms as Static
Retail is dynamic — your planograms should be too. Many retailers fail to refresh layouts often enough, resulting in outdated assortments.
- Avoid this by: Reviewing and optimizing planograms quarterly or with every major campaign.
The Role of Technology in Visual Merchandising Planograms
The days of static PDFs, printed diagrams, and guesswork are over. In the modern retail ecosystem, technology has transformed planogram management—turning what was once a manual, time-consuming process into a dynamic, data-driven, and measurable system.
Here’s how the right tech stack can redefine your visual merchandising planograms from creation to execution:
1. AI-Powered Planogram Design
Artificial intelligence can now generate optimized layouts automatically—using data from sales, shopper behavior, and space availability.
- Example: AI tools can allocate more facings to high-performing SKUs or adjust for regional product preferences.
- Impact: Faster creation, fewer errors, and layouts that truly reflect market demand.
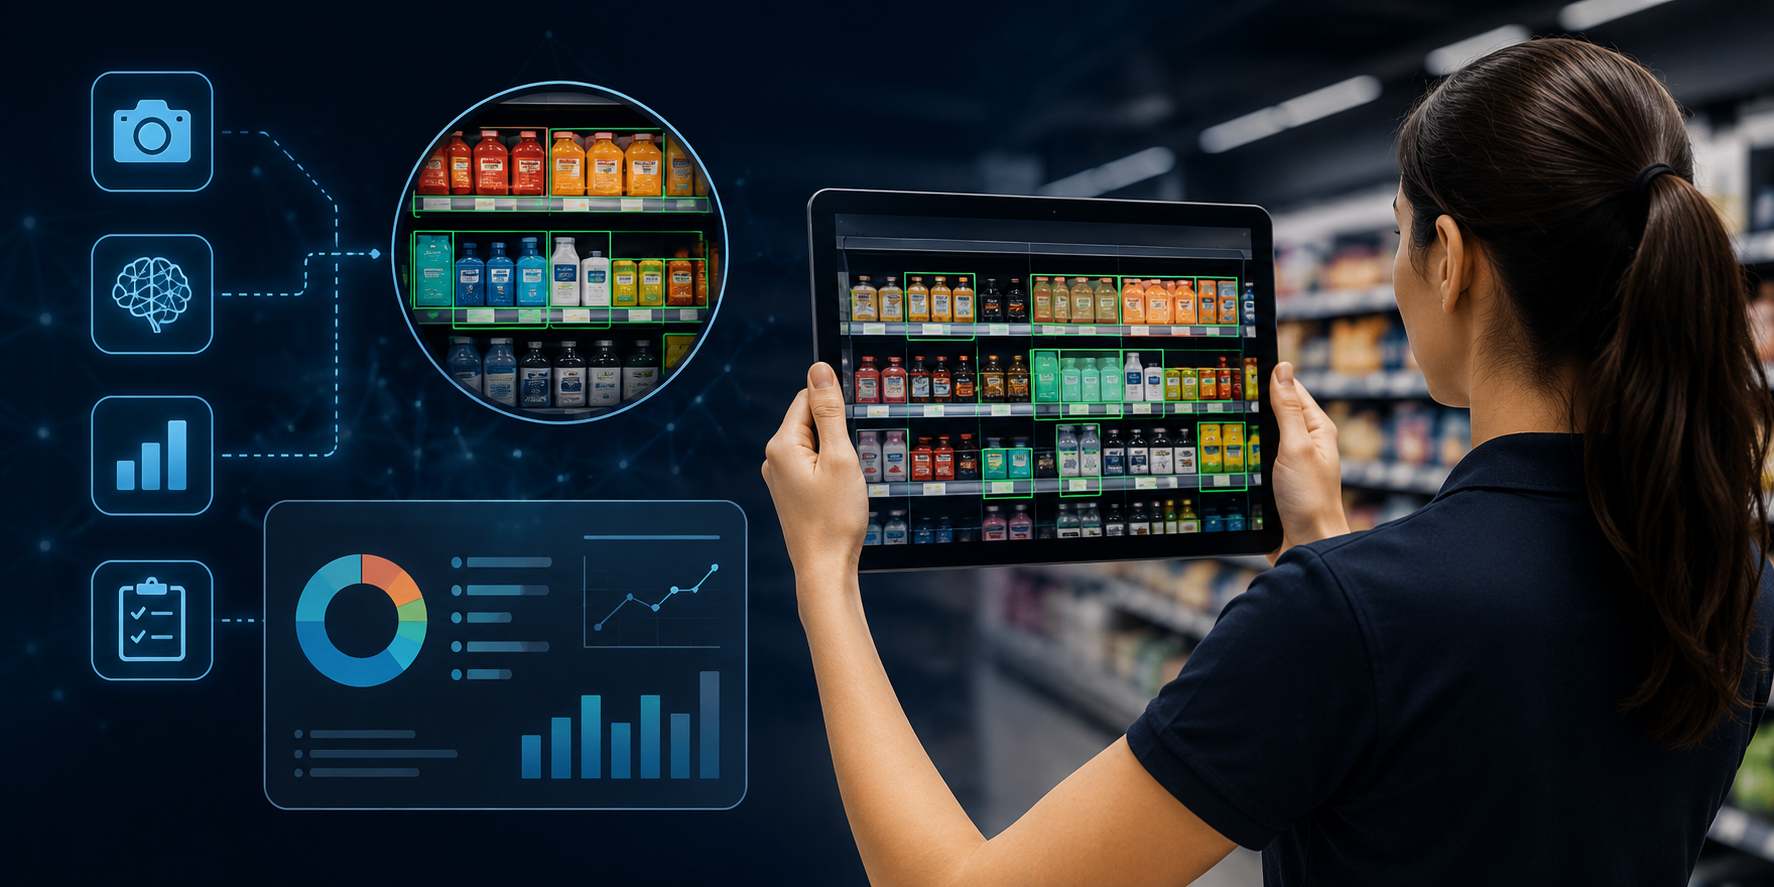
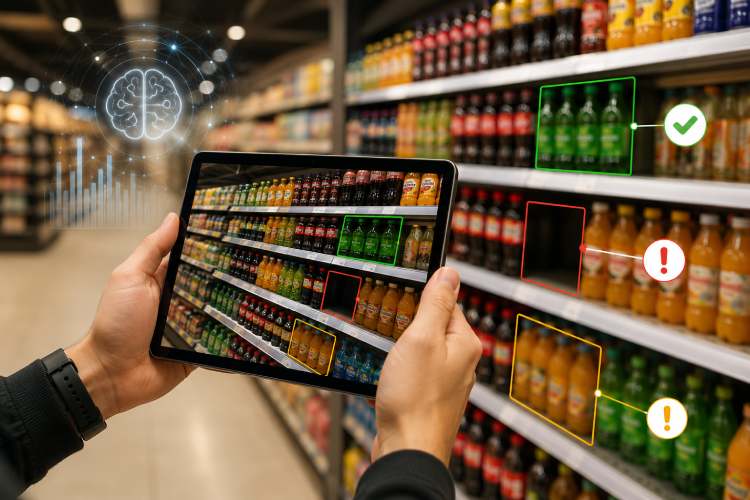
2. Image Recognition for Compliance Verification
Gone are the days of manually inspecting every store. Advanced image recognition tools let retailers verify if shelves match their planograms simply by analyzing photos uploaded from the field.
- Impact: Instant compliance checks and quick corrections for misplaced or missing SKUs.
3. Mobile-First Execution Tools
Store staff no longer rely on printed guides or lengthy emails. Mobile apps now deliver digital checklists, annotated visuals, and task-by-task instructions directly to associates’ devices.
- Impact: Faster rollout, fewer mistakes, and consistent execution across every location.
4. Real-Time Dashboards and Analytics
With centralized dashboards, HQ teams gain full visibility into shelf performance—tracking compliance, sales lift, and execution speed in real time.
- Impact: Retailers can identify bottlenecks, address underperforming stores, and measure ROI instantly.
5. Integration with POS and Inventory Data
Modern planogram platforms integrate seamlessly with POS systems and inventory databases. This means layout adjustments can happen automatically when stock levels, sales trends, or promotions change.
- Impact: Smarter replenishment and planograms that stay accurate—even in fast-moving categories.
6. Augmented Reality (AR) and 3D Visualization
AR-enabled planogram tools allow merchandisers to visualize shelf layouts in a real-world environment before rollout.
- Impact: Easier training, better visualization, and reduced setup time.
7. Continuous Optimization Through Analytics
Once executed, planograms aren’t left to chance. Technology now enables a closed feedback loop—linking execution data back to analytics for ongoing refinement.
- Impact: Every cycle improves the next one, creating a culture of continuous improvement.
Pazo’s Role in Enhancing Visual Merchandising Planograms
Most retailers struggle not with creating planograms — but with executing and monitoring them at scale. That’s where Pazo comes in. It bridges the gap between strategy and in-store reality, ensuring that every shelf, every display, and every product placement aligns perfectly with your visual merchandising goals.
Here’s how Pazo transforms planogram implementation and performance tracking:
1. Digital Checklists for Flawless Execution
Store staff no longer need to interpret static PDFs or lengthy instructions.
- Pazo provides mobile-first digital checklists that guide employees step-by-step during planogram execution.
- Each task is timestamped, trackable, and linked directly to HQ dashboards.
✅ Result: Consistency across every store and category.
2. Photo-Based Proof of Execution
Visual verification is at the heart of compliance.
- Staff upload real-time photos of completed displays.
- HQ teams can instantly compare these images against approved planograms.
✅ Result: Transparent proof of compliance and faster approval cycles.
3. Real-Time Dashboards for HQ Visibility
Retail leaders get complete visibility into store-level execution without needing to visit each outlet.
- Pazo’s dashboards show which stores are compliant, which need attention, and which planograms are driving sales.
✅ Result: Data-driven decisions and proactive problem-solving.
4. Automated Escalations for Faster Issue Resolution
When an issue is detected — like a missing SKU or incorrect product placement — Pazo automatically triggers an escalation.
- Notifications go directly to responsible staff or managers.
✅ Result: Errors are fixed before they impact sales.
5. Analytics Loop to Improve Future Planograms
Pazo doesn’t stop at execution — it closes the loop with analytics.
- The platform tracks sales lift, dwell time, and compliance rates tied to each planogram.
- These insights feed back into the next cycle of planogram design and optimization.
✅ Result: Continuous improvement and smarter merchandising decisions.
6. Seamless Collaboration Between HQ and Store Teams
Pazo aligns everyone involved — from category managers and visual merchandisers to store associates and regional heads.
- Centralized communication means fewer errors, faster rollouts, and stronger accountability.
✅ Result: Unified execution across your entire retail network.
Conclusion
At its core, visual merchandising planograms are more than just shelf diagrams — they’re the blueprint for how your brand speaks to shoppers. But a brilliant design means little if it’s not executed with precision, measured with data, and improved over time.
Retail success today depends on one thing: the ability to translate visual strategy into consistent, high-performing in-store experiences.
That’s where technology — and especially Pazo — changes the game. From digital checklists to real-time photo validation, from compliance analytics to escalation workflows, Pazo ensures that your planograms don’t just exist on paper — they live and perform on the shelf.
Wrap-up: Visual merchandising excellence isn’t just about beautiful layouts — it’s about measurable impact, shopper engagement, and flawless execution.
ABOUT THE AUTHOR
Enjoyed this read?
Stay up to date with the latest video business news, strategies, and insights sent straight to your inbox!
Oops! Something went wrong while submitting the form.