Retail
Visual Merchandising Analysis: How to Track, Audit & Optimize Store Execution
Understand visual merchandising analysis with real-time tracking, audits, and performance insights to improve compliance and retail store results.

CEO - Pazo

Understand visual merchandising analysis with real-time tracking, audits, and performance insights to improve compliance and retail store results.
Visual merchandising analysis is the process of evaluating how products are displayed in-store and how those displays impact customer behavior and sales performance. It helps retailers understand what is working, what is not, and where improvements are needed. In modern retail, product placement, display design, and store layout directly influence buying decisions. Without proper analysis, stores may have visually appealing displays that fail to convert into sales. A structured approach allows retailers to identify gaps, optimize product visibility, and improve overall execution. In simple terms, visual merchandising analysis turns store presentation into a measurable and performance-driven system.
Visual merchandising analysis is the process of evaluating how product displays, store layouts, and visual elements perform in influencing customer behavior and driving sales. It involves assessing whether products are placed correctly, displays are effective, and visual standards are followed consistently. This analysis helps retailers understand which displays attract attention, which convert into purchases, and where improvements are needed. Instead of relying on assumptions, it uses data and observation to measure performance. In simple terms, visual merchandising analysis ensures that store displays are not just attractive—but also effective in driving results.
Visual merchandising analysis is important because it helps retailers understand how store displays actually perform—not just how they look. A display may appear attractive, but without analysis, there is no way to know if it is driving customer engagement or sales. By analyzing merchandising execution, retailers can identify gaps in product visibility, placement, and display effectiveness. This allows them to make data-driven decisions instead of relying on assumptions. It also ensures consistency across multiple store locations. In simple terms, visual merchandising analysis turns store displays into a measurable and optimized sales driver.
To make visual merchandising analysis effective, retailers need to track the right metrics. These metrics help measure how well product displays, layouts, and visual elements are performing in real store conditions. Without measurable data, merchandising decisions are based on assumptions rather than actual performance. By tracking key metrics, retailers can identify which displays drive sales, which products need better visibility, and where improvements are required. These insights allow continuous optimization of store execution. In simple terms, metrics turn visual merchandising into a data-driven performance system.
This measures how much each product is selling. It helps identify whether product placement and visibility are effective. Low sales may indicate poor positioning or weak display impact.
This metric shows how efficiently store space is being used. It helps retailers understand which areas of the store generate the most revenue and which areas need improvement.
Conversion rate measures how many visitors actually make a purchase. If foot traffic is high but sales are low, it may indicate issues with product visibility or display effectiveness.
Comparing how many customers enter the store versus how many buy helps identify gaps in merchandising execution. It highlights whether displays are engaging enough to convert visitors.
This measures how closely stores follow defined product placement guidelines. Poor compliance can lead to inconsistent displays and reduced performance.
This evaluates how specific displays or sections perform in terms of engagement and sales. It helps retailers understand which displays attract attention and drive conversions.
Visual merchandising analysis is not just about checking if displays look good—it is about evaluating how different elements of the store contribute to sales and customer experience. Retailers need to focus on specific areas that directly influence visibility, engagement, and conversion. By analyzing these areas, they can identify gaps, improve execution, and optimize store performance. Each element plays a role in shaping how customers interact with products. In simple terms, this step ensures that every part of the store is working toward driving results.
Analyze whether high-priority products are placed in visible areas such as eye level or high-traffic zones. Poor placement can reduce visibility and affect sales, even if the product has high demand.
Evaluate how well displays attract attention and encourage interaction. Check if featured displays are driving engagement and leading to actual purchases.
Study how customers move through the store. Identify whether the layout guides them toward key product areas or creates confusion and missed opportunities.
Assess whether pricing, offers, and product information are clearly communicated. Poor or unclear signage can reduce customer confidence and delay purchase decisions.
Examine whether lighting highlights key products and enhances the overall store atmosphere. Poor lighting can reduce product appeal and visibility.
Check for empty shelves or missing products in key areas. Out-of-stock items can disrupt the customer journey and lead to lost sales.
A visual merchandising analysis checklist helps retailers systematically evaluate store displays and identify performance gaps. It ensures that all critical areas—such as product placement, display quality, and store presentation—are reviewed consistently. Without a checklist, analysis can become inconsistent and important issues may be missed. A structured checklist makes the evaluation process easier, faster, and more reliable across multiple stores. It also helps teams focus on high-impact areas that directly influence sales. In simple terms, a checklist turns visual merchandising analysis into a repeatable and measurable process.
Ensure that basic display execution and product visibility are maintained.
Focus on consistency and effectiveness of displays.
Evaluate overall performance and identify improvement areas.
Conducting visual merchandising analysis requires a structured and disciplined approach that combines observation, data, and consistent evaluation. It is not just about identifying what is wrong, but understanding why it is happening and how it affects sales and customer behavior. Many retailers perform audits, but fail to connect insights with actionable improvements. A clear step-by-step process ensures that analysis leads to measurable outcomes such as better product visibility, improved conversions, and optimized store layouts. Each step builds on the previous one, creating a continuous loop of evaluation and improvement. In simple terms, this process transforms visual merchandising from a static setup into a dynamic, performance-driven system.
Begin by identifying what you want to achieve through the analysis. Objectives could include improving sales of specific products, increasing visibility of new launches, or evaluating promotional effectiveness. Clear goals ensure that the analysis is focused and aligned with business priorities rather than being a generic review.
Data provides the foundation for meaningful analysis. Gather information such as sales per SKU, foot traffic, conversion rates, and inventory movement. This helps you understand how visual merchandising is impacting actual performance rather than relying only on visual observations.
Review store displays, product placement, and overall presentation either through physical visits or digital tools. Check whether displays are clean, organized, and aligned with defined standards. This step helps capture real execution conditions on the shop floor.
Evaluate whether stores are following defined planograms and visual merchandising guidelines. Identify any deviations in product placement, display setup, or layout. Even small inconsistencies can lead to significant differences in performance.
Analyze the data and observations to identify underperforming areas. Determine whether issues are due to poor placement, weak displays, lack of stock, or unclear signage. Understanding the root cause is critical for making effective improvements.
Take immediate action to fix identified gaps. This may include repositioning products, updating displays, improving signage, or restocking key items. Assign clear ownership and timelines to ensure that issues are resolved quickly.
Visual merchandising analysis should be an ongoing process. Track performance after changes are implemented and measure improvements using defined metrics. Continuous monitoring helps refine strategies and ensures long-term consistency across stores.
During visual merchandising analysis, retailers often discover that the biggest issues are not in planning—but in execution. Even well-designed displays and strategies can fail if they are not implemented correctly at the store level. These problems directly affect product visibility, customer experience, and sales performance. Identifying these issues early helps prevent revenue loss and improves overall store efficiency. Most of these challenges are repetitive and can be solved with better monitoring and structured processes. In simple terms, visual merchandising analysis reveals the hidden gaps that impact store performance.
High-priority products are often placed in low-visibility areas. Even strong products fail to sell if customers cannot easily notice them. This reduces conversion despite good inventory and demand.
Too many products on a single display can confuse customers and reduce focus. Clutter makes it difficult for shoppers to identify key products, leading to lower engagement.
Stores may not follow defined planograms due to convenience or lack of clarity. Even small deviations in placement can impact sales and disrupt consistency across locations.
Promotions may not be placed in high-traffic areas or may lack proper signage. This reduces their impact and leads to missed sales opportunities.
If the layout does not guide customers effectively, they may miss important sections or products. This results in lower exposure and reduced sales potential.
Out-of-stock products in high-visibility areas break the customer journey and lead to lost sales. Empty shelves reduce trust and affect overall store perception.
Unclear pricing or missing information can confuse customers and delay purchase decisions. Strong signage is essential for guiding customer actions.
To make visual merchandising analysis effective, retailers must go beyond basic audits and focus on consistent, data-driven evaluation. Best practices help ensure that analysis leads to real improvements rather than just observations. When applied correctly, they improve accuracy, speed, and impact of merchandising decisions. These practices also help maintain consistency across stores and reduce recurring execution gaps. Over time, they turn analysis into a continuous improvement system. In simple terms, best practices ensure that visual merchandising analysis delivers measurable business results.
Prioritize areas that directly influence sales, such as entry zones, eye-level shelves, and promotional displays. Analyzing these areas first ensures maximum impact with minimal effort.
Do not rely only on how displays look. Use performance data such as sales and conversion rates along with visual checks to get a complete picture.
Avoid overly complex checklists. Focus on key factors like placement, visibility, and display effectiveness to make analysis more actionable.
Visual merchandising should be reviewed frequently, not occasionally. Regular analysis helps identify issues early and maintain consistent execution.
Photo-based validation helps confirm whether displays are implemented correctly. It reduces ambiguity and improves accountability across stores.
Compare results across stores to identify top-performing locations and areas that need improvement. Benchmarking helps improve overall consistency.
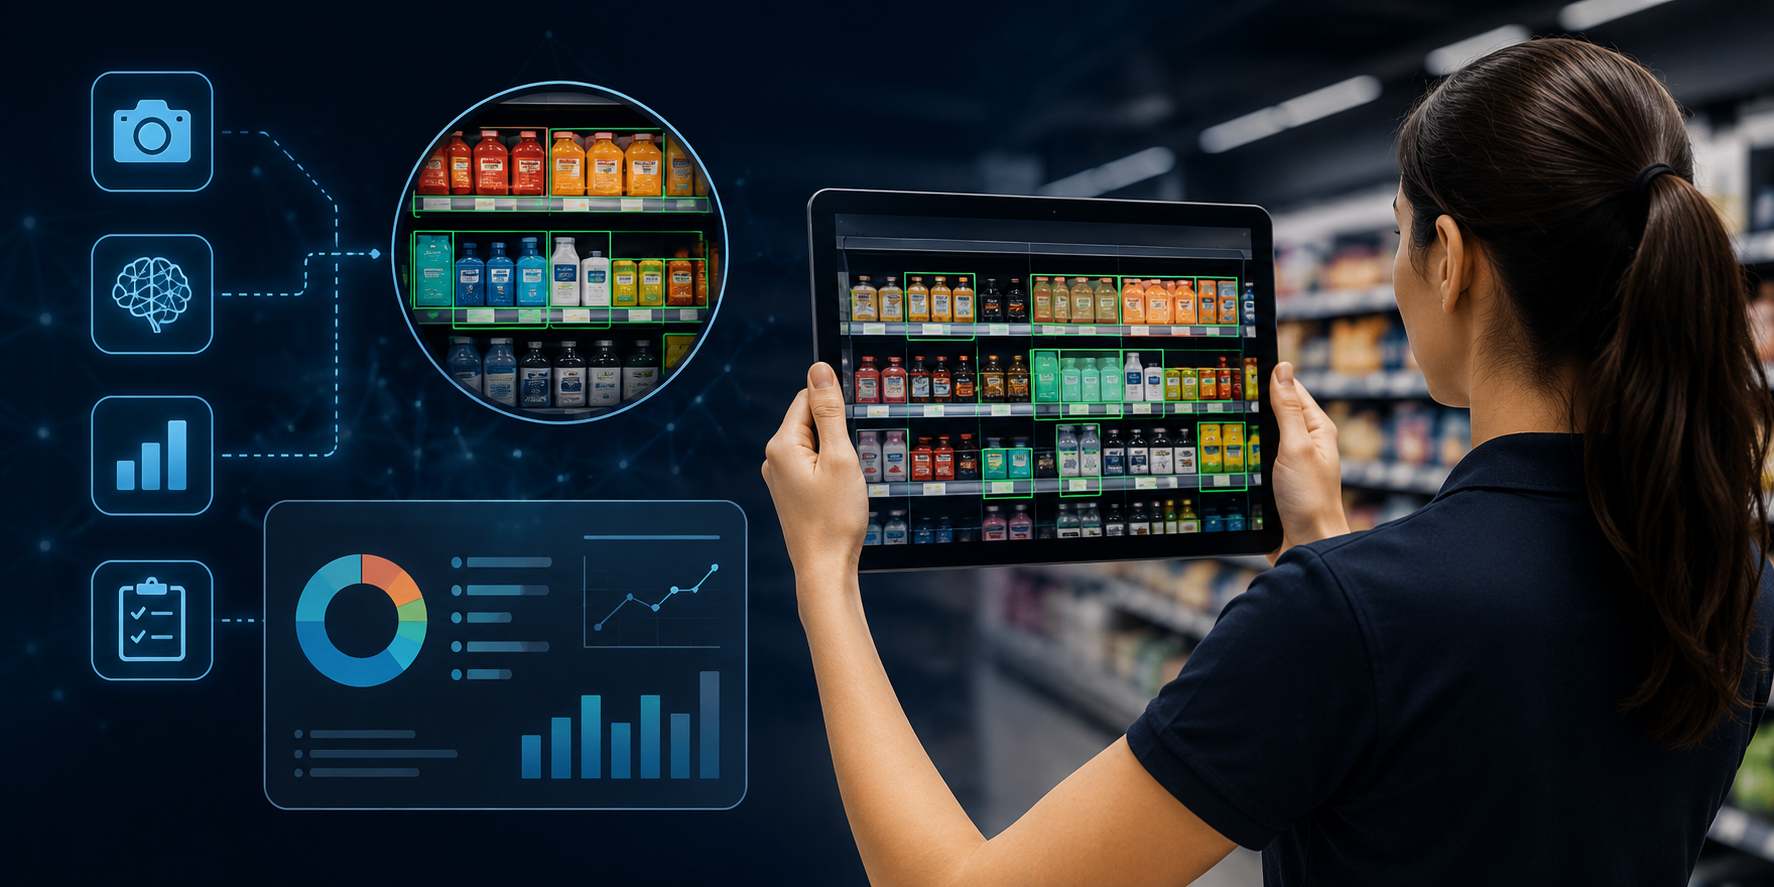
Managing visual merchandising analysis manually becomes difficult as retail operations scale. Technology helps retailers move from periodic audits to continuous, real-time analysis. Instead of relying on delayed reports or manual checks, digital tools provide instant visibility into store-level execution and performance. This allows faster identification of issues and quicker corrective action. Technology also improves accuracy, reduces human error, and strengthens accountability across teams. In simple terms, it transforms visual merchandising analysis into a faster, scalable, and data-driven process.
Digital platforms provide a centralized view of merchandising execution across all locations. Managers can instantly see which stores are compliant and where issues exist.
Standardized digital checklists ensure that analysis is consistent across stores. They reduce manual errors and make it easier to track performance over time.
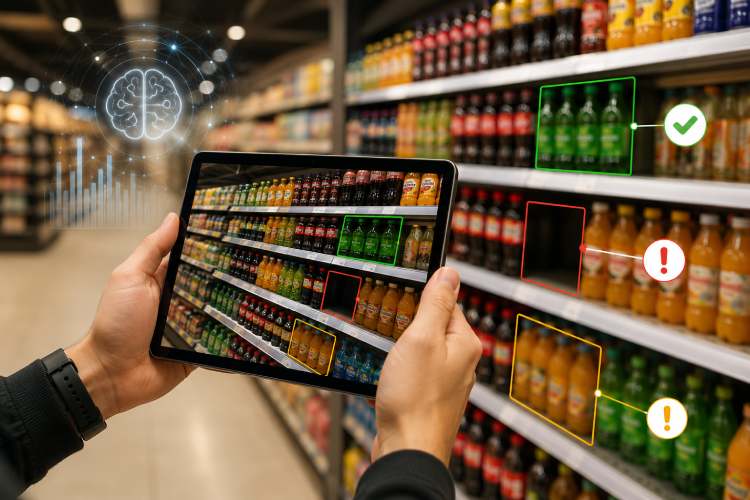
Store teams can upload images of displays as proof. This allows remote verification of product placement, display quality, and overall execution.
Technology can alert teams about missed tasks, compliance gaps, or performance issues. This ensures faster action and reduces delays.
All merchandising data is stored in one place, making it easier to analyze trends, compare store performance, and identify recurring issues.
Issues identified during analysis can be assigned and resolved quickly. Faster response reduces the impact of merchandising gaps on sales.
Effective visual merchandising analysis requires consistent data, clear execution tracking, and real-time visibility across stores. This is where Pazo helps retailers streamline and strengthen their analysis process. Instead of relying on manual audits or delayed reporting, Pazo converts merchandising analysis into a structured, trackable, and real-time system. It allows retailers to monitor store execution, identify gaps quickly, and take corrective action without delay. By combining data, visuals, and workflows, Pazo ensures that analysis leads to measurable improvements. In simple terms, it helps retailers move from observing problems to solving them at scale.
Pazo allows retailers to create standardized visual merchandising audits with clear checkpoints. This ensures that every store is evaluated consistently across all key areas.
Managers can monitor merchandising performance across all locations through a centralized dashboard. This helps identify non-compliant stores instantly.
Store teams can upload images of displays as proof. This allows remote validation of product placement, display quality, and planogram compliance.
Issues identified during analysis can be converted into tasks and assigned to specific team members with deadlines, ensuring quick resolution.
Pazo notifies teams about missed tasks or compliance gaps, helping reduce delays and maintain consistent execution.
Pazo provides data on compliance trends and recurring issues. Retailers can use these insights to improve merchandising strategies and store performance.
Visual merchandising analysis is not just about reviewing store displays—it is about understanding how those displays impact customer behavior and sales. When retailers analyze product placement, display effectiveness, and store layout, they gain valuable insights into what drives performance.
The real value comes from acting on those insights. Retailers that regularly analyze and optimize their merchandising are able to improve product visibility, increase conversions, and maintain consistency across stores.
By combining structured analysis, data-driven decisions, and continuous improvement, visual merchandising becomes a powerful tool for growth. In today’s competitive retail environment, retailers who measure and optimize their store execution will always stay ahead.
As someone who has built highly scalable products from the ground up, I've always been drawn to solving challenging problems. But it's the quest for operational excellence that truly lights my fire. The thrill of streamlining processes, optimizing efficiency, and bringing out the best in a business – that's what gets me out of bed in the morning. Whether I'm knee-deep in programming or strategizing solutions, my focus is on creating a ripple effect of excellence that transforms not just businesses, but the industry at large. Ready to join forces and raise the bar for operational excellence? Let's connect and make retail operations and Facilities Management better, together.
Stay up to date with the latest video business news, strategies, and insights sent straight to your inbox!