Retail
Planogram Analytics: Turning Shelf Data into Sales Insights
Learn how planogram analytics boosts performance by tracking shelf sales, compliance, and stock availability.
Introduction
“You can’t improve what you don’t measure—and that includes planograms.” Retailers invest significant time and resources designing layouts and pushing them to stores, but without measuring how those planograms perform, it’s impossible to know whether they’re driving sales or wasting valuable shelf space.
This is where planogram analytics comes in—the missing link between design, execution, and results. By tracking compliance, sales impact, and shopper interaction, analytics reveals what’s working on the shelf and what isn’t. Without it, retailers risk leaving billions on the table every year through unoptimized shelves, poor stock allocation, and inconsistent execution.
What is Planogram Analytics?
Planogram analytics is the process of using data and performance metrics to evaluate how well your planograms are working in-store. It goes beyond just creating layouts or executing them—it measures their real-world impact on sales, compliance, and shopper behavior.
To put it simply:
- Planogram creation defines the intended layout.
- Planogram execution brings that layout to life in the store.
- Planogram analytics tells you whether the layout is actually effective.
The core purpose of analytics is to answer the critical questions every retailer faces:
- Are layouts being followed correctly across all stores?
- Are shelf placements increasing visibility and boosting sales?
- Are high-margin products getting the space they deserve?
- Where are the compliance gaps that lead to lost revenue?
Why Planogram Analytics Matters
Without analytics, planograms are just educated guesses. Measuring their performance turns shelves into a source of insights that drive profitability and consistency.
- Improve Sales Performance → Analytics highlights underperforming SKUs and zones, helping retailers reallocate space to products that actually drive revenue.
- Optimize Shelf Space → Instead of relying on category norms or intuition, retailers can allocate space based on real performance data.
- Detect Compliance Issues → Analytics quickly identifies stores not following layouts, so HQ can address gaps before they impact sales.
- Enable Data-Driven Merchandising → Every adjustment is guided by proof, not assumptions—leading to smarter decisions at both HQ and store levels.
- Strengthen Supplier Trust → Retailers can validate trade agreements with evidence, showing suppliers that promised facings and placements are being delivered in reality.
Key Planogram Performance Metrics to Track
Measuring planogram effectiveness requires the right set of performance indicators. These metrics reveal not only how shelves are being used but also how well they’re contributing to sales and compliance.
- Sales by Shelf/Zone → Tracks revenue contribution from each shelf or zone, showing which areas of the store generate the most impact.
- Sales per Facing → Measures the ROI of visibility by evaluating how many units are sold relative to the number of facings a product receives.
- Planogram Compliance Rate → Monitors how closely stores are following the assigned layouts, helping HQ detect and fix execution gaps.
- Stock Availability → Identifies out-of-stocks and replenishment delays, ensuring shelves stay full and planograms remain effective.
- Product Performance by Segment → Compares SKUs and categories to see which ones perform best within specific layouts.
- Task Completion Rate → Tracks whether resets and merchandising tasks were completed on time across all stores.
Analytical Techniques in Planogram Analytics
Tracking the right metrics is only half the equation—retailers also need the right techniques to turn raw data into actionable insights. Here are the most effective approaches:
- Sales Data Analysis → Compare before-and-after results to measure the true impact of planograms. Metrics like sales per square foot reveal how effectively space is being monetized.
- Comparative Store Analysis → Benchmark performance across locations to identify which stores are excelling and which ones are falling behind, uncovering regional or operational differences.
- Customer Tracking → Use dwell time studies, in-store heatmaps, or shopper movement data to understand how customers interact with displays and which areas attract the most attention.
- A/B Testing Layouts → Test variations of product placement or facings to see which configurations drive the highest sales and engagement.
- Shelf Stock Accuracy → Compare stock levels on the shelf against actual sales demand to prevent both out-of-stocks and overstocking.
- Visualization Tools → Heatmaps and shelf load visualizations help merchandisers see at a glance how space is being used, and whether brand or category allocations match their sales contribution.
Leveraging Data for Smarter Merchandising
Planogram analytics doesn’t just measure performance—it provides the insights needed to make merchandising smarter and more adaptive. By leveraging data, retailers can ensure shelves reflect both customer demand and operational realities.
- Localized Adaptations → Shopper behavior differs by region and store format. Analytics makes it possible to tailor planograms to local preferences, ensuring assortments feel relevant and maximize sales potential.
- Trend & Seasonality Forecasting → Sales data reveals patterns around holidays, back-to-school, or seasonal events. With analytics, retailers can proactively adjust layouts to capture peak demand windows.
- Inventory Alignment → Linking planograms with replenishment cycles prevents stockouts and overstocking. Analytics ensures shelves stay synchronized with actual product availability.
- Continuous Feedback Loops → Each cycle of execution generates data. Feeding that back into the next round of planning enables continuous refinement, making planograms smarter over time.
How Technology Enhances Planogram Analytics
Modern retail demands more than manual audits and spreadsheets. Technology now makes it possible to measure, verify, and optimize planogram performance in real time.
- AI-powered engines → Analyze sales and shelf data instantly to surface insights on product visibility, performance, and efficiency.
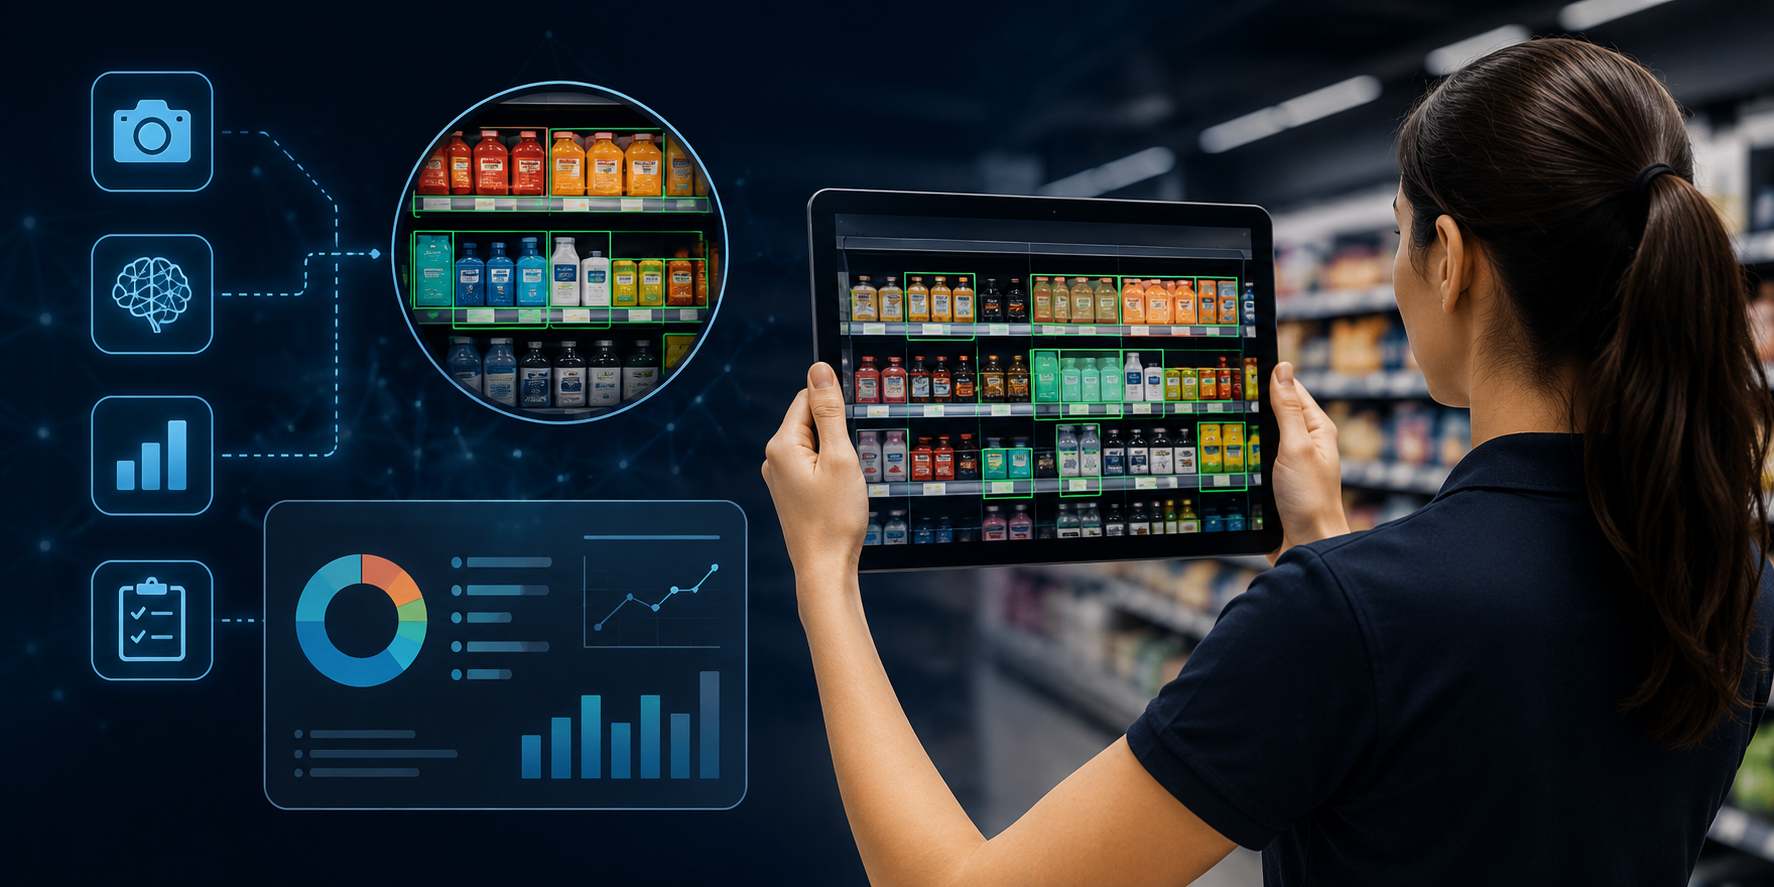
- Image recognition → A single shelf photo can confirm whether a store is compliant with its planogram, eliminating hours of manual checking.
- Mobile apps → Equip store staff to capture execution data and send it directly to HQ, closing the gap between field operations and strategy.
- Dashboards → Give central teams live visibility into planogram compliance and its impact on sales and profitability.
- Automated alerts → Spot deviations as soon as they occur, so issues can be fixed before they cause lost sales.
Pazo’s Approach to Planogram Analytics
Pazo integrates execution and analytics into one streamlined system:
- Digital checklists → Standardize data collection during planogram execution.
- Photo-based proof → Validate every shelf against its assigned planogram.
- Centralized dashboards → HQ teams gain 100% visibility into compliance and performance across all stores.
- Escalation workflows → Non-compliance issues trigger automatic follow-ups until resolved.
- Continuous analytics loop → Every execution feeds back into analysis, linking layouts → compliance → sales impact for ongoing optimization.
Conclusion
Planogram analytics isn’t just reporting—it’s the engine of smarter merchandising. Retailers who measure effectively can optimize layouts, boost compliance, and maximize sales impact.
Discover how Pazo helps retailers measure, analyze, and optimize planogram performance at scale.
ABOUT THE AUTHOR
Sharjeel Ahmed
As someone who has built highly scalable products from the ground up, I've always been drawn to solving challenging problems. But it's the quest for operational excellence that truly lights my fire. The thrill of streamlining processes, optimizing efficiency, and bringing out the best in a business – that's what gets me out of bed in the morning. Whether I'm knee-deep in programming or strategizing solutions, my focus is on creating a ripple effect of excellence that transforms not just businesses, but the industry at large. Ready to join forces and raise the bar for operational excellence? Let's connect and make retail operations and Facilities Management better, together.
Stay up to date with the latest video business news, strategies, and insights sent straight to your inbox!