Back Button
Learn more
Visual Merchandising KPIs: Measure What Drives Retail Performance
Retail

Visual Merchandising KPIs: Measure What Drives Retail Performance

Track visual merchandising KPIs like sales per sq. ft, conversion rate & dwell time to turn creative displays into measurable retail performance.

Nethra Ramani Author
Sharjeel Ahmed
CEO - Pazo

Introduction: Measuring What Moves the Shopper

In retail, creativity gets people to look — but data tells you whether they buy. That’s where visual merchandising KPIs come in.

Beautiful store displays, premium product placements, and immersive lighting setups might grab attention, but without tracking how these efforts translate into sales, engagement, and conversions, they’re just decoration. Key Performance Indicators (KPIs) bridge that gap — turning visual appeal into measurable retail performance.

By monitoring the right KPIs, retailers can understand which displays drive purchases, which layouts increase dwell time, and where shoppers lose interest. In short, visual merchandising KPIs reveal whether your creative strategy is truly influencing customer behavior — or just filling space.

1. Sales Performance KPIs

The first and most obvious indicator of visual merchandising success is sales.
But the key isn’t just how much you sell — it’s what, where, and why those sales happen.

Sales performance KPIs help retailers tie every shelf display, window setup, and product placement directly to revenue outcomes. These metrics highlight which visuals convert browsers into buyers and which displays fail to move the needle.

Here are the most critical ones to track:

  • Sales per Transaction (SPT): Measures the average amount spent per customer purchase. An increase in SPT often signals that visual merchandising is successfully encouraging cross-selling and impulse buying.
  • Weekly or Campaign Sales Lift: Compares sales before and after implementing new displays. This metric shows whether a particular layout or visual concept is actually boosting performance.
  • Sales per Square Foot: Evaluates how efficiently every inch of store space is being monetized. High-performing layouts maximize visibility and accessibility for high-margin products.
  • Average Transaction Value (ATV): Tracks whether your merchandising strategy drives customers toward premium or bundled products. Effective displays make shoppers want to spend more.
  • Sell-Through Rate: The percentage of display inventory sold within a specific period. A healthy sell-through rate suggests your visual presentation is aligned with customer demand and product appeal.

2. Conversion & Traffic KPIs

You can’t sell to an empty store — and you can’t assume every visitor becomes a buyer. That’s why conversion and traffic KPIs are essential for measuring how effectively your visual merchandising turns curiosity into action.

These metrics go beyond aesthetics; they reveal how shoppers move, pause, and purchase within your store.

  • Foot Traffic Volume: Tracks how many people enter your store or pass specific zones. A strong visual display near entry points can dramatically increase this number — it’s your first conversion opportunity.
  • Conversion Rate: Measures the percentage of visitors who make a purchase. A compelling product display or an engaging layout should nudge casual browsers toward checkout.
  • Customer Dwell Time: The average time shoppers spend in the store or a specific section. Longer dwell time typically indicates high engagement — shoppers are exploring, not rushing out.
  • Stopping Power: The percentage of shoppers who stop to engage with a display. It’s the clearest sign your visuals are catching attention and sparking interest.
  • Revisit Rate: Measures how often customers return to the same display or store area. If they come back, it means your presentation left a memorable impression.

3. Visual & Display Effectiveness KPIs

A display isn’t successful just because it looks beautiful — it’s successful when it sells beautifully. That’s where visual and display effectiveness KPIs come in. These metrics measure how well your creative execution drives engagement, visibility, and in-store action.

They tell you whether your displays are truly doing their job — stopping, inspiring, and converting.

  • Visual Display Impact: Evaluates how engaging your displays are, using sales lift, customer feedback, or foot traffic as indicators. A strong visual concept should translate into noticeable behavioral change.
  • Product Placement Effectiveness: Tracks how relocating products affects sales. For instance, moving a product to eye level or pairing it with a complementary item often yields a 10–15% sales increase.
  • Planogram Compliance Rate: Measures how closely in-store displays match their designed layouts. Even the most strategic visual plan fails without accurate execution — compliance keeps creativity consistent.
  • Eye-Tracking & Heatmap Metrics: Identify where shoppers look first and for how long. Heatmaps reveal which zones grab attention — and which areas need stronger visual storytelling.
  • Display Refresh Frequency: Tracks how often visual elements are updated or replaced. Frequent refreshes keep stores feeling new and relevant, boosting repeat visits and impulse purchases.

4. Inventory & Stock KPIs

A visually stunning display means little if the products it promotes aren’t in stock. That’s why inventory and stock KPIs are essential — they connect your visual merchandising strategy with supply chain reality.

These indicators ensure that what shoppers see is actually available to buy, keeping the shelf experience seamless and profitable.

  • Stock Availability: Measures the percentage of products that are available on the shelf as per the display plan. High availability means fewer lost sales opportunities and happier shoppers.
  • Out-of-Stock Rate: Tracks how often key SKUs are missing from displays. Even a 5% out-of-stock rate can have a major impact on conversion and brand trust.
  • Display Stock Turnover: Indicates how frequently displayed products are replenished or rotated. A healthy turnover rate ensures freshness and visual appeal while keeping assortments relevant.
  • Inventory Accuracy: Compares system-level stock data with actual on-shelf quantities. Discrepancies here often point to operational inefficiencies or execution gaps.
  • Sell-Through Rate: The percentage of display inventory sold during a specific timeframe. A high sell-through rate suggests that visual presentation is aligned with shopper intent and product demand.

5. Customer Experience KPIs

Visual merchandising isn’t just about what shoppers see — it’s about how they feel when they see it.

That’s why customer experience KPIs focus on the emotional and behavioral impact of your displays. These metrics reveal whether your store experience is engaging, inspiring, and driving loyalty.

  • Customer Satisfaction / NPS (Net Promoter Score): Measures how shoppers perceive your visual presentation and store environment. High satisfaction or NPS scores mean your visuals are creating positive emotional connections.
  • Engagement Rate: Tracks interactions with visual elements like digital screens, demo areas, or sensory displays. It shows how effectively you’re blending experience with conversion.
  • Dwell Time per Zone: Measures how long customers spend in key display areas. Longer dwell times signal interest, curiosity, and engagement — the foundations of in-store influence.
  • Post-Visit Purchase Intent: Evaluates whether shoppers plan to buy later after engaging with a display. It’s a great way to measure the longer-term influence of brand storytelling.
  • Wayfinding & Navigation Ease: Assesses how intuitively customers move through the store layout. A seamless flow keeps attention on products — not confusion or clutter.

These KPIs give visual merchandisers a clear window into the shopper’s mind and heart. They turn aesthetics into actionable insights — showing how emotion, engagement, and experience drive real retail results.

6. Benchmarking KPI Targets (Examples)

Knowing what to measure is one thing — knowing what good looks like is another. Benchmarking helps retailers compare their visual merchandising performance against industry standards and set realistic goals for improvement.

Here’s what strong visual merchandising performance typically looks like in retail:

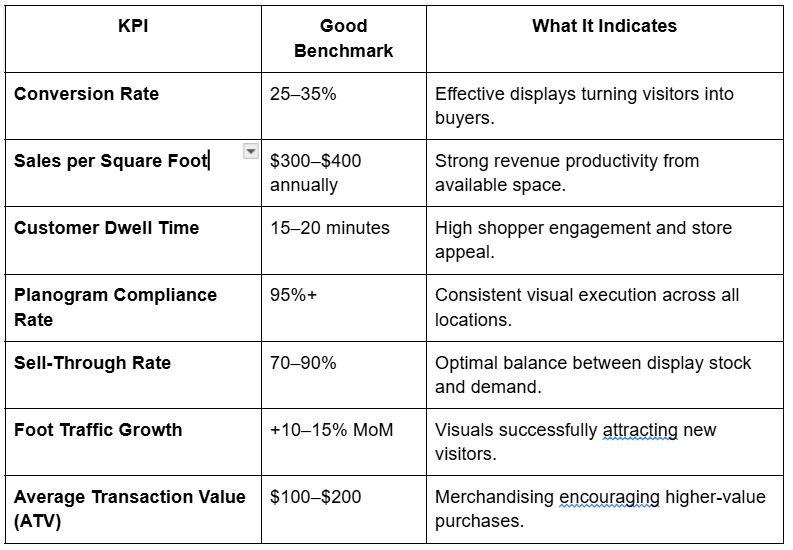
👉 Note: Benchmarks vary by category, season, and store type. For instance, luxury and lifestyle retailers often see higher transaction values but lower conversion rates, while convenience or FMCG stores focus on quick turnover and volume.

Tracking these benchmarks regularly helps teams spot strengths, address weak zones, and align creative strategies with measurable business outcomes.

7. Best Practices for Tracking Visual Merchandising KPIs

KPIs are only powerful if they’re consistent, contextual, and actionable. The right tracking habits turn your data into a decision-making engine — helping you fine-tune visuals, layouts, and displays in real time.

Here’s how top-performing retailers do it:

  • Track KPIs Regularly (Not Occasionally): Review performance weekly or by campaign cycle. Merchandising impact fades fast — timely insights prevent missed opportunities.
  • Combine Quantitative + Visual Proof: Pair sales and traffic data with photo validation or heatmaps. Seeing how shelves look provides the “why” behind the numbers.
  • Focus on Cause, Not Just Correlation: Don’t just note that sales dropped — trace it to low compliance, poor lighting, or misplaced products. KPIs are signals, not surface stats.
  • Align KPIs With Store Goals: Match your metrics to your objectives — e.g., focus on dwell time for flagship stores, or ATV for high-margin categories.
  • Collaborate Cross-Functionally: Share KPI insights across VM, operations, and marketing teams. Unified data storytelling drives better strategic alignment.
  • Benchmark, Then Iterate: Use historical data to set baselines. Improvement comes from iteration — not one-time analysis.
  • Automate Where Possible: Use digital checklists, dashboards, and image-recognition tools to reduce manual work and human error in KPI reporting.

8. Conclusion: Turning Creativity Into Measurable Impact

Visual merchandising used to be judged by instinct — now, it’s measured by insight.
Every mannequin, endcap, or shelf display tells a story, but only data reveals whether that story sells.

By tracking the right KPIs, retailers bridge the gap between art and analytics — transforming store layouts from static visuals into living, measurable systems of performance.

Sales per square foot shows the return on your space. Conversion and dwell time show how customers engage. Compliance and stock KPIs ensure flawless execution. Together, these metrics give retailers the power to optimize, adapt, and grow — store after store.

In the end, great visual merchandising isn’t about making products look good. It’s about making every visual decision work harder.

Nethra Ramani Author
ABOUT THE AUTHOR
Sharjeel Ahmed

As someone who has built highly scalable products from the ground up, I've always been drawn to solving challenging problems. But it's the quest for operational excellence that truly lights my fire. The thrill of streamlining processes, optimizing efficiency, and bringing out the best in a business – that's what gets me out of bed in the morning. Whether I'm knee-deep in programming or strategizing solutions, my focus is on creating a ripple effect of excellence that transforms not just businesses, but the industry at large. Ready to join forces and raise the bar for operational excellence? Let's connect and make retail operations and Facilities Management better, together.

Enjoyed this read?

Stay up to date with the latest video business news, strategies, and insights sent straight to your inbox!

Thank you! Your submission has been received!
Oops! Something went wrong while submitting the form.