On-Shelf Availability (OSA): Definition, Formula, Benchmarks & How to Improve It
Learn what On-Shelf Availability (OSA) means in retail, how to calculate it, ideal benchmarks (95–98%), common causes of stockouts, and proven strategies to improve shelf availability and protect revenue.
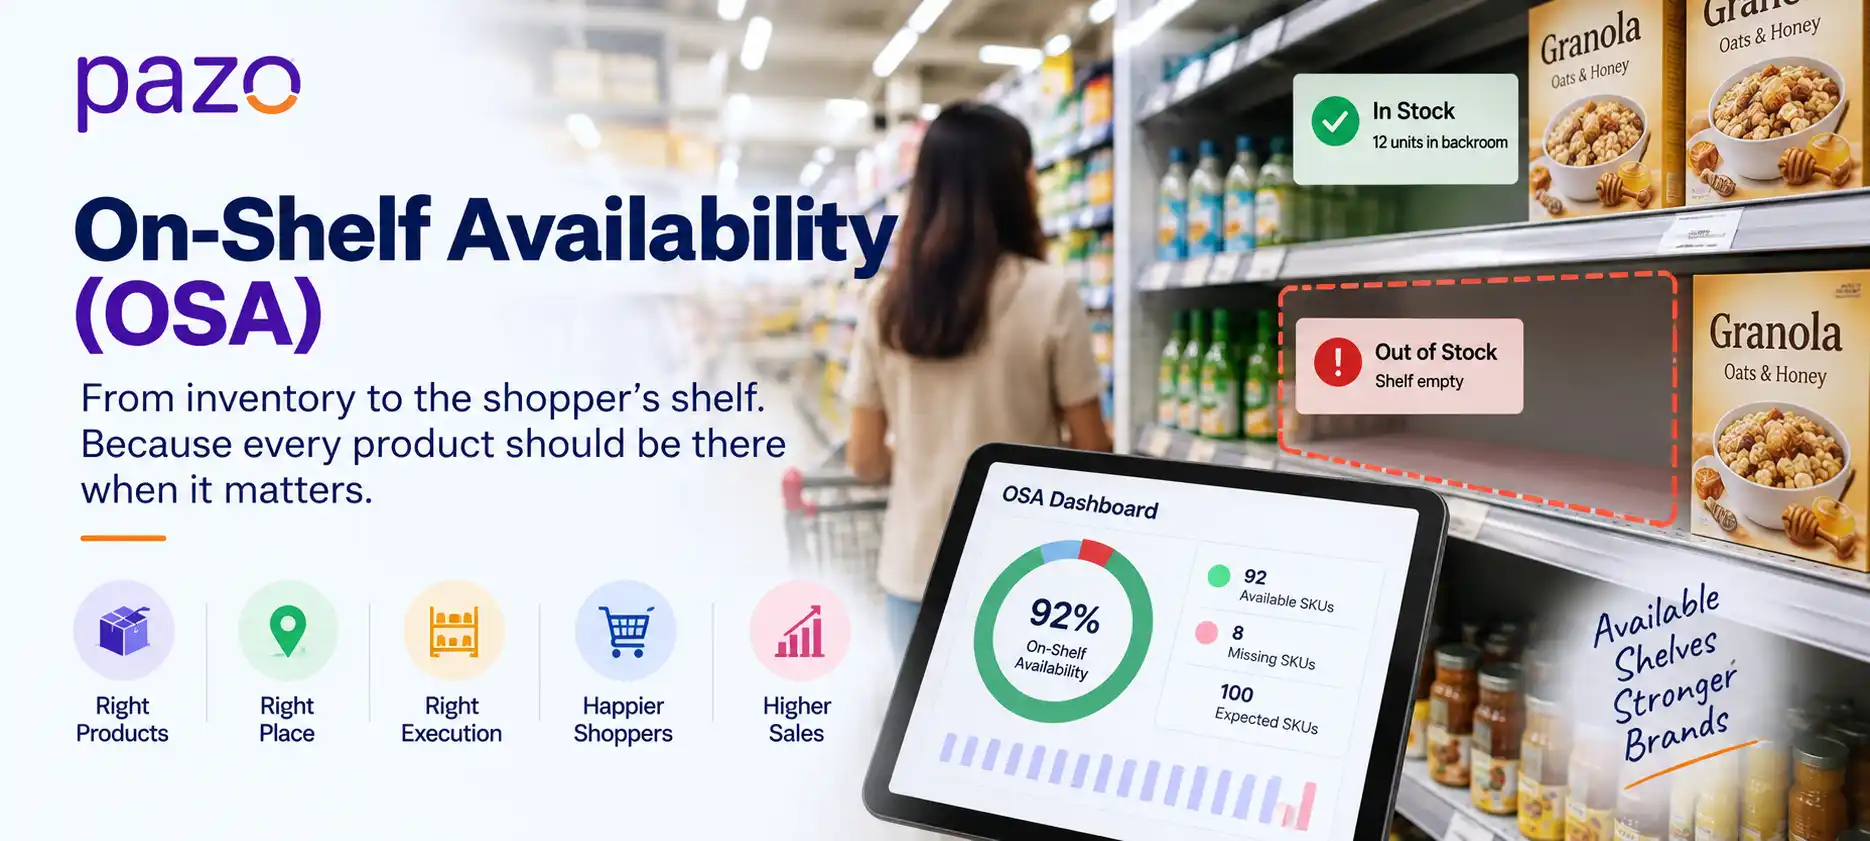
On-shelf availability (OSA) is the percentage of products shoppers can
actually find and buy on the shelf when they want them.
OSA (%) =
Available expected SKUs
÷
Total expected SKUs
× 100
92
Available SKUs
÷
100
Expected SKUs
=
92%
ON-SHELF AVAILABILITY
!
The important distinction:
A product can be “in stock” but still unavailable to the shopper
if it is sitting in the backroom or missing from the shelf.
This guide explains how to calculate OSA, choose a meaningful benchmark, distinguish shelf out-of-stocks from true store stockouts, diagnose the root cause of shelf gaps, and build a closed-loop process to improve availability.
What Is On-Shelf Availability in Retail?
On-shelf availability measures whether a product is physically available and accessible to the shopper at its expected selling location when the shopper wants to buy it.
The key word is shopper.
Inventory availability asks:
“Does the retailer have the product?”
OSA asks:
“Can the shopper find and buy the product?”
Those questions are not always answered the same way.
Consider this example:
System inventory: 20 units
Backroom inventory: 20 units
Shelf inventory: 0 units
The retailer technically has stock. But from the shopper’s perspective, the product is unavailable.
This distinction is central to OSA. ECR Retail Loss defines the problem from the shopper’s perspective: whether the shopper can find the product on the shelf when they want it. It also distinguishes this from simply having stock somewhere inside the store.
OSA therefore sits at the end of a much longer retail chain:
Demand → Supply → Store Inventory → Backroom → Replenishment → Shelf Execution → Shopper Access → Sale
A failure anywhere along this chain can eventually appear as an empty shelf.
That is why an empty shelf should not automatically be treated as a supply problem.
OSA measures shopper-accessible product availability, not simply whether inventory exists somewhere in the retail network.
How Is On-Shelf Availability Calculated?
OSA is calculated by dividing the number of expected SKUs available on the shelf by the total number of expected SKUs, then multiplying by 100.
OSA Calculation
How to Calculate On-Shelf Availability
OSA measures the percentage of expected SKUs that are physically available on the shelf.
OSA (%) =
Available expected SKUs
÷
Total expected SKUs
× 100
Example: 100 Expected SKUs
92
Available SKUs
÷
100
Expected SKUs
× 100
92%
OSA
On-Shelf Availability
92%
92 available ÷ 100 expected × 100
Measures the share of expected SKUs available on the shelf.
OOS Rate
8%
8 unavailable ÷ 100 expected × 100
Measures the share of expected SKUs unavailable on the shelf.
!
The denominator matters.
Your OSA calculation is only meaningful when the
expected SKU universe
is clearly defined—for example, active store-assortment SKUs or promotional SKUs.
The OSA denominator is more important than it looks
The formula is easy. Defining the denominator correctly is harder.
The total should represent the products that were actually expected to be available during the measurement period.
Depending on the purpose of the audit, a retailer might use:
Defining the OSA Denominator
Which SKUs Should Be Included in OSA?
The SKU universe you choose determines what your OSA percentage actually means.
SKU Universe
What It Includes
All listed SKUs
Products in the wider catalogue
Store-authorized SKUs
Products the specific store is expected to carry
Active/ranged SKUs
Products currently included in the assortment
Expected-on-shelf SKUs
OSA Relevant
Products expected at the time of observation
Promotional SKUs
Products specifically expected during a promotion
!
Why this matters:
Two retailers can report different OSA percentages for the same shelf simply because
they define the expected SKU universe differently. Define the denominator before
comparing OSA across stores, categories or periods.
For example, suppose a retailer has 1,000 products in its master catalogue, but Store A is authorized to carry only 600. If 570 of those 600 are available, its operational OSA is 95%, not 57%.
A useful OSA report should therefore document at least three things:
Which products were expected?
When was availability observed?
What exactly qualifies as unavailable?
Without those rules, two teams can inspect the same stores and produce different OSA numbers.
Key takeaway: The OSA formula is simple, but the result is meaningful only when the retailer has a clearly defined SKU universe, observation period, and availability rule.
What Is the Difference Between OSA, Store OOS, Shelf OOS and Inventory Availability?
OSA measures shopper availability; store OOS and shelf OOS describe different types of product absence; inventory availability describes what the retailer believes or knows is in stock.
Know the Difference
Inventory Availability vs. OOS vs. OSA
These metrics describe different points in the journey from inventory to shopper purchase.
Metric
Question It Answers
Example
▣
Inventory availability
Does inventory exist according to the system or physical count?
System shows 12 units
×
Store OOS
Is the product unavailable anywhere in the store?
No units on shelf or in backroom
!
Shelf OOS
Is the product missing from the shelf even though stock may exist elsewhere?
12 in backroom, shelf empty
✓
On-Shelf Availability (OSA)
Can the shopper find and buy the expected product?
Product accessible on shelf
!
The key distinction:
A store can have inventory without having the product available to the shopper.
That is why shelf-level execution matters when measuring OSA.
This distinction matters because the corrective action changes with the diagnosis.
ECR research specifically separates store out-of-stocks from shelf out-of-stocks. A shelf OOS can occur when the product is in the backroom, in the wrong location, in a cage or trolley, or otherwise unavailable to the shopper despite being somewhere on the premises.
Consider:
System inventory: 12 Backroom inventory: 12 Shelf inventory: 0
Ordering another 12 units is unlikely to solve the immediate problem.
The first action is to move existing stock from the backroom to the selling shelf.
Now consider:
System inventory: 0 Backroom inventory: 0 Shelf inventory: 0
That requires a different investigation: supply, ordering, allocation, distribution or replenishment parameters.
OSA tells you what the shopper experiences. OOS and inventory information help explain where the availability chain failed.
Why Does On-Shelf Availability Fall? Use a 5-Layer Diagnostic Framework
The fastest way to diagnose OSA is to trace the shelf gap through five layers: Supply → Inventory → Backroom → Shelf Execution → Shopper Availability.
An empty shelf is an observation, not a root cause.
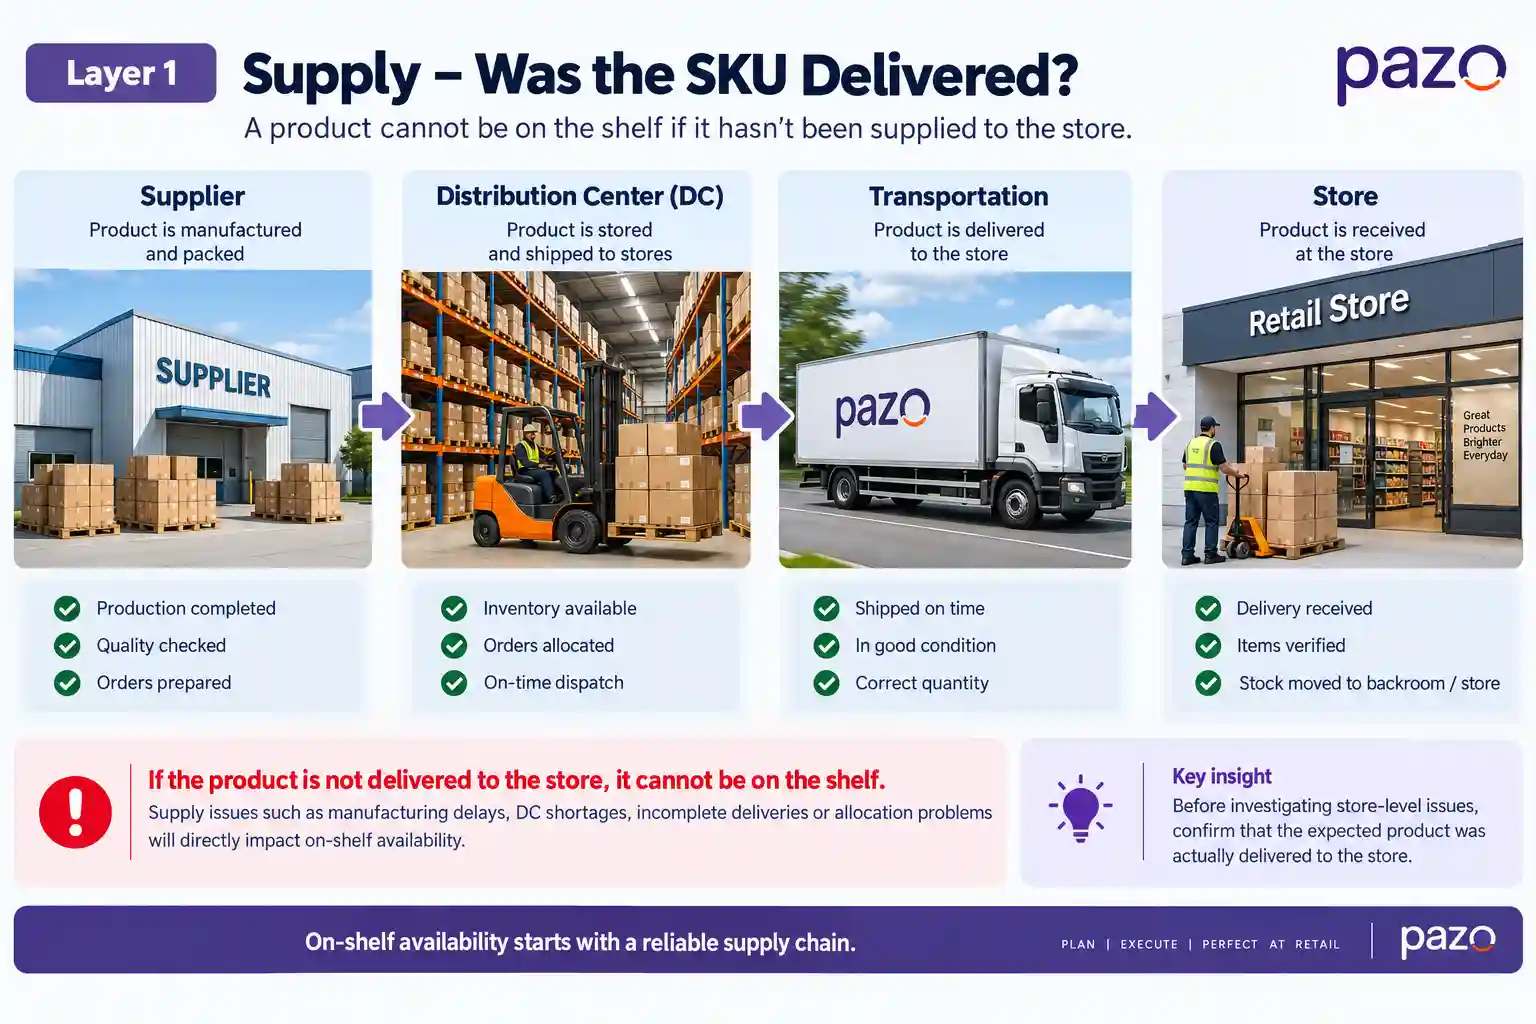
Layer 1: Supply — Was the SKU delivered?
Start upstream.
Ask:
Was the expected product actually delivered to the store?
Possible causes include:
Supplier delays
Distribution-center shortages
Incomplete deliveries
Incorrect order quantities
Allocation problems
Demand exceeding the planned supply
If the product never arrived, a store associate cannot replenish it.
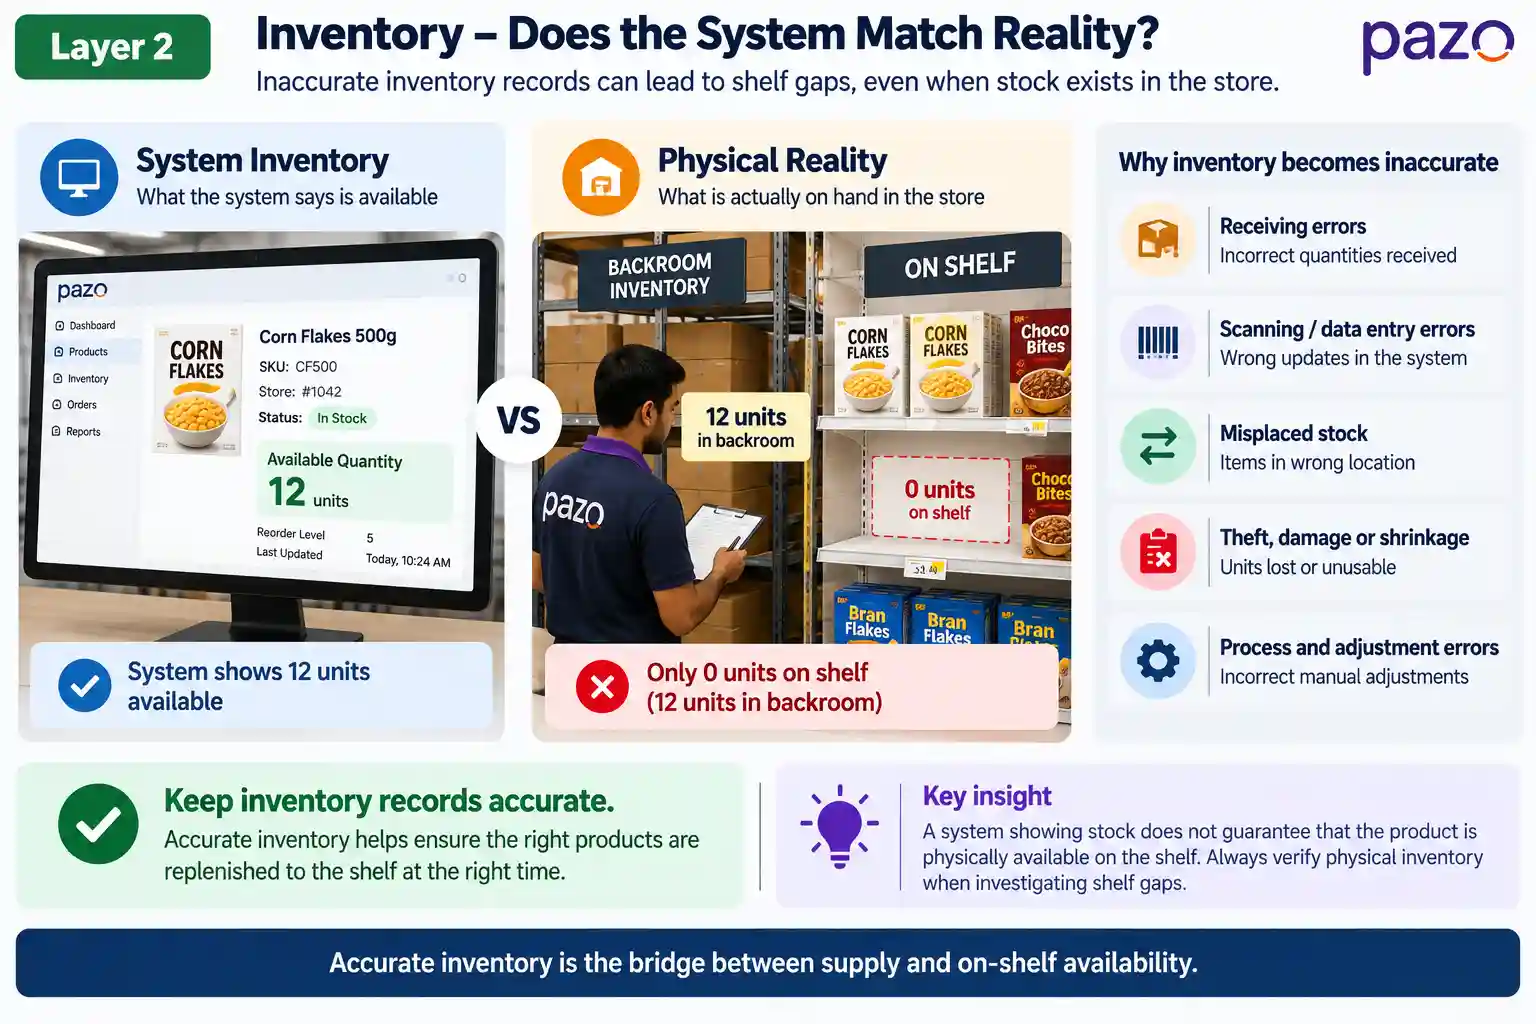
Layer 2: Inventory - Does the system reflect physical reality?
Next ask:
Can the retailer trust the inventory record?
Inventory records can become inaccurate through receiving errors, incorrect adjustments, theft, damage, misplaced products, checkout errors and other process failures.
This is not a theoretical issue. ECR research found that correcting inventory inaccuracies produced approximately 4–8% sales increases across participating retailers in controlled test-and-control experiments. The research also found that inaccurate records can lead to stock being replenished too late or too early.
A system showing 10 units does not prove that 10 saleable units are actually available.
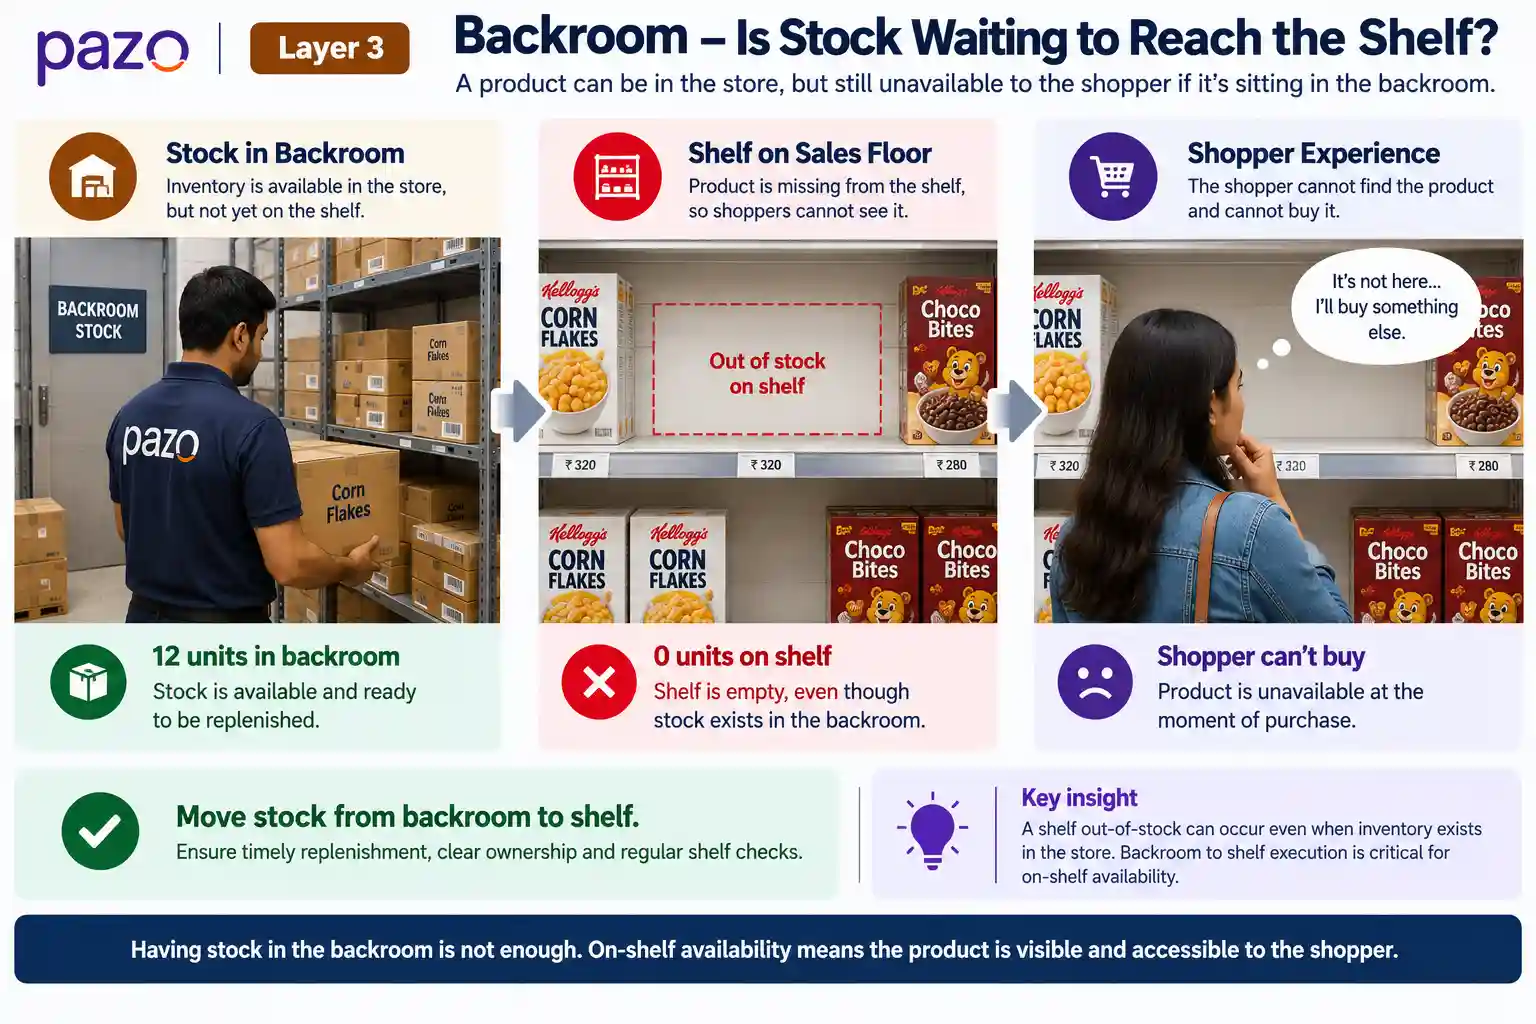
Layer 3: Backroom - Is stock waiting to reach the shelf?
If physical inventory exists, ask:
Is saleable stock sitting in the backroom while the shelf is empty?
This is one of the clearest examples of a shelf OOS.
The store has inventory. The shopper does not.
The operational causes may include poor backroom organization, inconsistent shelf checks, unclear ownership, insufficient labor or weak replenishment routines.
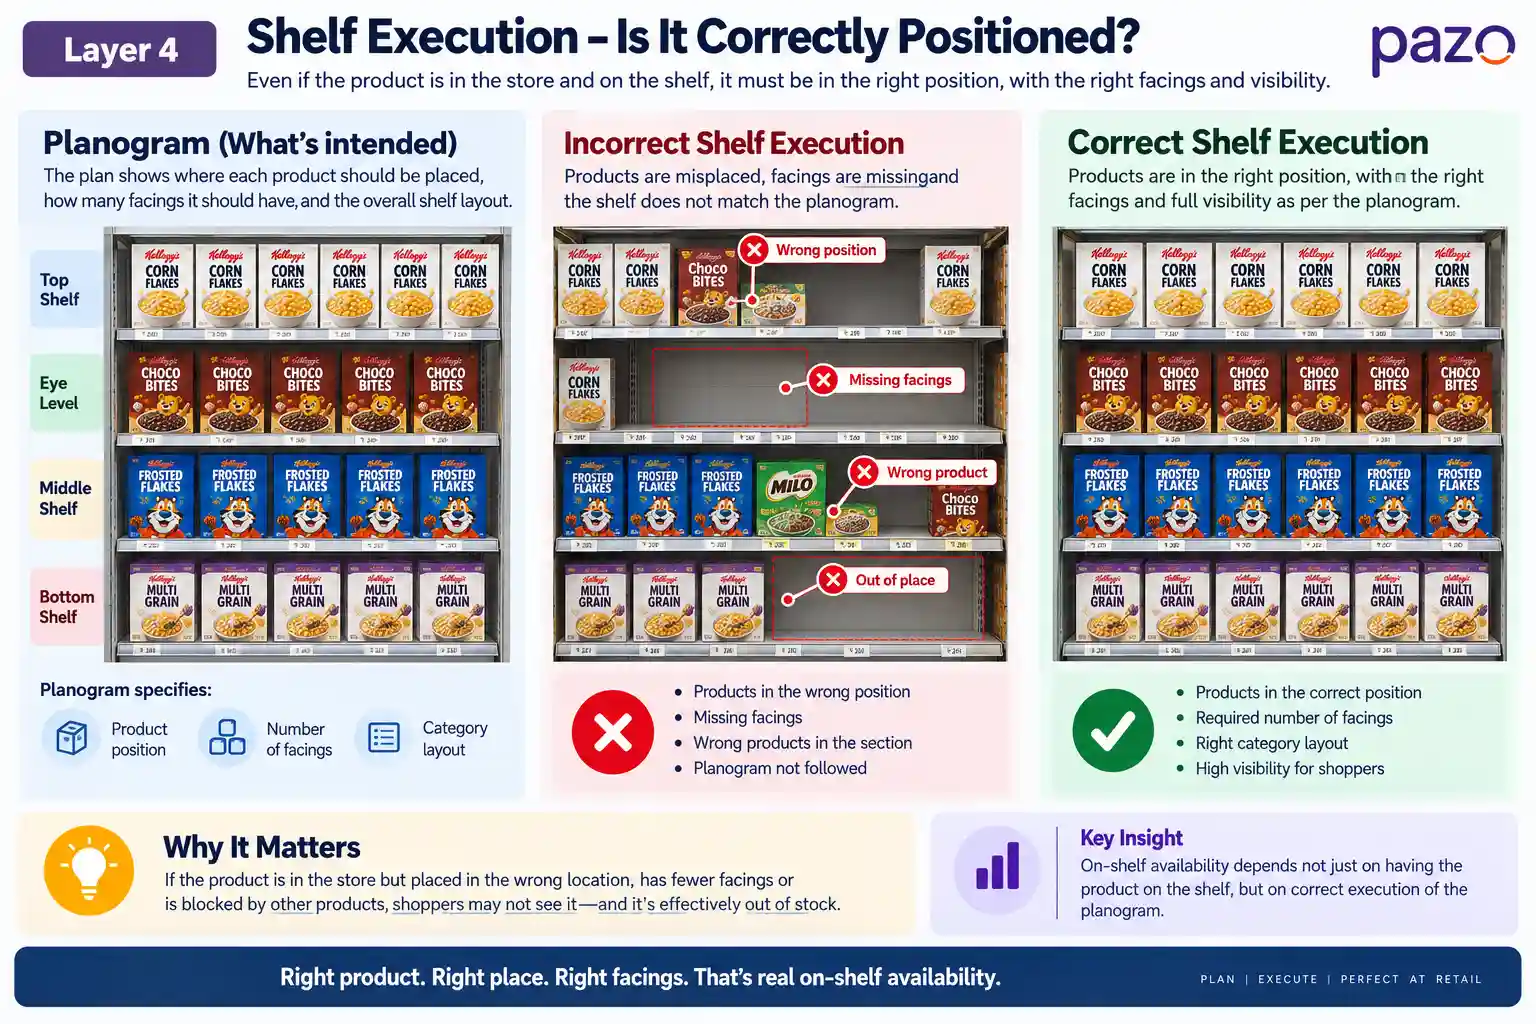
Layer 4: Shelf execution-Is the product correctly positioned?
If the product has reached the sales floor, ask:
Is it in the correct location, with the required facings and visibility?
Check:
Product position
Facings
Shelf capacity
Planogram compliance
Price-label execution
Promotional placement
Product visibility
A product can physically exist on the sales floor and still fail the intended shelf standard.
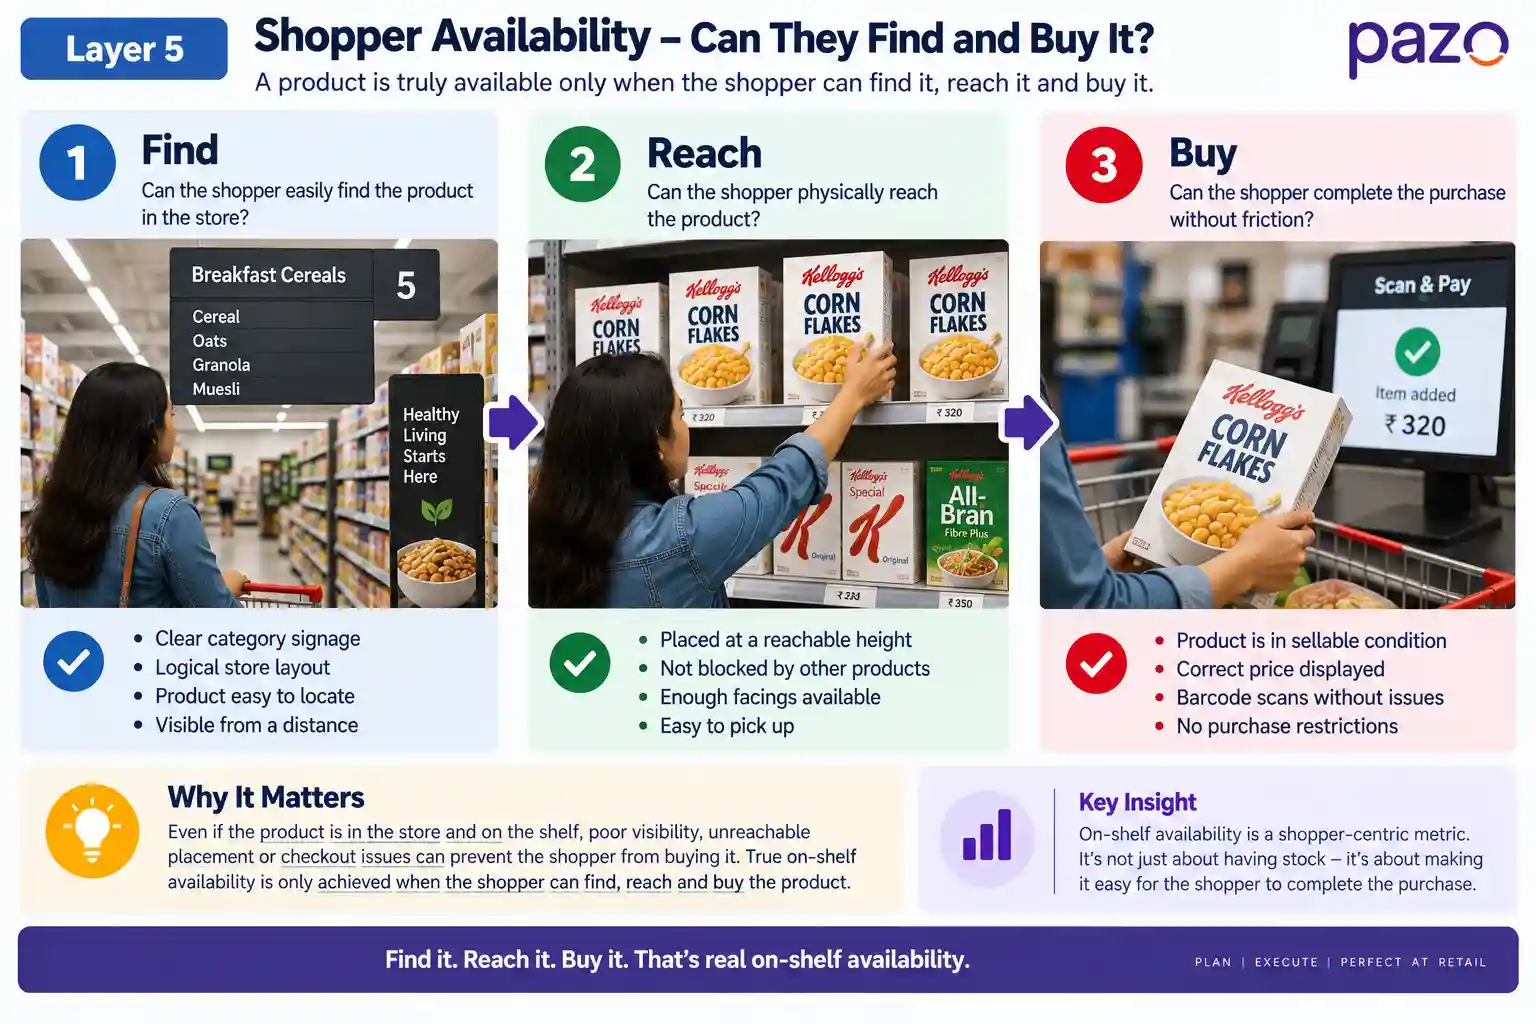
Layer 5: Shopper availability - Can the shopper actually buy it?
The final test is simple:
Can the shopper find, reach and purchase the product when they want it?
That is the outcome OSA is ultimately trying to measure.
OSA Root-Cause Diagnosis
Diagnose OSA From Supply to Shopper
An empty shelf is the symptom. Trace the problem upstream before deciding
that the store simply needs more inventory.
SYMPTOM
!
Empty shelf
What went wrong?
→
01
↗
Was it delivered?
Check supply
→
02
#
Is inventory accurate?
System vs reality
→
03
▦
Is stock in the backroom?
Stock waiting to move
→
04
↻
Was it replenished?
Shelf execution
→
05
□
Is it correctly positioned?
Planogram & facings
→
OUTCOME
✓
Can the shopper buy it?
Shopper availability
TRACE UPSTREAM BEFORE ADDING INVENTORY
!
Don't treat every empty shelf as an inventory problem.
Adding inventory before identifying the failure point can increase stock
without fixing the actual cause—whether the issue is supply, inventory
accuracy, backroom stock, replenishment or shelf execution.
What Is a Good On-Shelf Availability Benchmark?
There is no single OSA percentage that should be treated as the right target for every retailer, category and SKU.
The old Pazo article presented 95–98% as a general strong OSA range and gave category-specific ranges. Those figures are too broad to use as universal targets without defining the measurement method and business context.
A better approach is to set targets according to:
Category × SKU velocity × Store format × Replenishment model × Promotion × Economics
For example, a fast-moving beverage SKU during a major promotion may deserve a more aggressive availability target than a slow-moving product with limited shelf life.
The economics also matter.
In fresh and perishable categories, pushing availability higher can require more inventory and can increase waste. ECR research explicitly describes OSA and waste as a trade-off and notes that the appropriate target can differ between dry grocery and perishables.
Published benchmarks can provide context, but they should not automatically become operational targets. APQC currently reports a median 88.0% for its cross-industry retail on-shelf/in-stock availability measure across 350 companies; importantly, its measure covers both online and store operations, so it should not be interpreted as a universal physical-store OSA target.
What should retailers benchmark instead?
Track OSA by:
Store
Category
SKU
SKU velocity
Promotion
Time period
Root cause
This tells you whether the problem is broad or concentrated.
A useful OSA target is not simply the highest possible percentage. It is the availability level that protects important sales while balancing inventory, labor, replenishment and waste economics.
How Should Retailers Measure On-Shelf Availability?
Retailers should measure OSA at SKU-store level and then aggregate the results to identify patterns by store, category, region, SKU and time period.
A store-wide OSA percentage is useful, but it can hide important failures.
Step 1: Define the expected assortment
Establish which SKUs the store should have available.
Do not automatically include discontinued, inactive or unauthorized products.
Step 2: Define “available”
Set a consistent rule.
For example:
A product is available when saleable stock is physically accessible to shoppers at its intended selling location.
The rule should be applied consistently across auditors and stores.
Step 3: Capture the shelf condition
Measurement can come from:
Store audits
Field-team checks
Mobile retail execution audits
SKU verification
Shelf photographs
Automated shelf-monitoring systems
ECR identifies independent audits, internal store audits and distribution/service-level measures among approaches used to understand shelf out-of-stocks.
Step 4: Measure at multiple levels
Track:
Store → Category → SKU → Priority SKU → Promotion → Time
The last three are particularly important.
A store may report 95% OSA while the five missing products are its five highest-volume SKUs.
That is a very different problem from losing five slow-moving products.
Step 5: Measure duration and recurrence
A shelf gap observed once is not equivalent to a SKU that repeatedly disappears for several hours.
Track:
Frequency of shelf gaps
Duration of gaps
Repeat failures
Root cause
Time to correction
This changes OSA from a static score into an operational performance measure.
Good OSA measurement answers three questions: How much availability are we achieving? Where are we losing it? Why do the same failures keep recurring?
How Can Retailers Improve On-Shelf Availability?
Retailers improve OSA by connecting shelf detection to root-cause diagnosis, corrective action, verification and prevention.
Identify which products are unavailable and where the failures are concentrated.
Prioritize:
High-velocity SKUs
Promotional products
High-margin products
New launches
Repeated shelf gaps
Not every SKU carries the same commercial risk.
2. Diagnose before ordering more stock
Ask:
Was it supplied? Is inventory accurate? Is stock in the backroom? Was it replenished? Is it correctly positioned? Is shelf capacity sufficient?
This prevents a retailer from treating every shelf gap as a purchasing problem.
3. Assign an owner
An OSA observation should create a clear operational responsibility.
A useful corrective task contains:
Store
SKU
Issue
Root cause
Required action
Owner
Due time
Verification requirement
For example:
SKU: Product A Issue: Shelf OOS Root cause: 8 units in backroom Action: Replenish shelf Owner: Store team Verification: Shelf photograph
The observation has now become an executable task.
4. Correct the actual cause
Diagnose → Fix
Match the Root Cause to the Right Corrective Action
An empty shelf is only the symptom. The corrective action depends on where the availability breakdown occurred.
Root Cause
Corrective Action
01
Product not delivered
→
Escalate supply/distribution issue
02
Inventory inaccurate
→
Investigate and correct inventory record
03
Stock in backroom
→
Replenish shelf
04
Wrong shelf position
→
Correct placement
05
Insufficient facings
→
Review shelf capacity and planogram
06
Promotion-driven depletion
→
Review allocation and replenishment frequency
✓
Diagnose before you correct.
Replenishing the shelf will not solve a supply failure, inaccurate inventory
or an incorrect planogram. The right fix starts with the right root cause.
5. Verify the correction
A task marked “complete” does not necessarily mean the shelf is fixed.
Verification can include:
Follow-up shelf audit
Photo evidence
SKU recheck
Supervisor validation
6. Prevent repeat failures
If the same SKU repeatedly becomes unavailable, investigate the pattern.
The underlying issue may be:
Replenishment frequency
Shelf capacity
Ordering parameters
Inventory accuracy
Promotion planning
Store labor
Backroom organization
The objective is not simply to close more tasks. It is to reduce the number of repeat shelf gaps.
How Does Planogram Compliance Affect On-Shelf Availability?
Planogram compliance and OSA measure different things, but poor shelf execution can directly affect product availability, visibility and replenishment.
OSA asks:
Can the shopper find and buy the product?
Planogram compliance asks:
Is the shelf being executed according to the intended merchandising standard?
Consider a product that should have three facings.
If the store gives it only one facing because another SKU has taken the space, the product may still be available—but its shelf capacity and visibility have changed.
Now consider the reverse:
Correct product
Correct position
Correct three facings
Zero units on shelf
Ten units in backroom
The planogram may be compliant while OSA is poor.
That is why retailers should analyze OSA alongside:
Product position
Facings
Shelf capacity
Price-label execution
Promotional compliance
Planogram compliance
The relationship is especially important for high-velocity SKUs. A product with limited facings may sell through between replenishment cycles even though the store has adequate total inventory.
A useful diagnostic distinction
Planogram problem: The shelf is not built or maintained according to the intended standard.
OSA problem: The shopper cannot obtain the expected product.
Combined problem: Poor shelf design or execution is contributing to repeated availability failures.
How Can Technology Improve On-Shelf Availability?
Technology improves OSA when it connects shelf evidence to diagnosis,
accountability and verification—not merely when it digitizes the audit form.
A connected OSA workflow
Audit
→
Evidence
→
Diagnose
→
Assign
→
Escalate
→
Verify
→
Analyze
Where does Pazo fit?
Pazo connects shelf observation
to corrective execution.
Its documented OSA workflow includes structured shelf audits,
photo-based validation, corrective task assignment, store-wise
OSA tracking and root-cause visibility.
Detect→Diagnose→Assign→Correct→Verify→Analyze
✓
Audit completed
Recording that a store visit or shelf audit happened does not
prove that the availability issue was resolved.
“The audit was completed.”
✓
Correction verified
Photo evidence and follow-up verification can show whether
the shelf was actually corrected.
“The shelf was actually corrected.”
What digital retail execution systems can capture
Store & SKU availability
Shelf photographs
Stockout observations
Root causes
Corrective actions
Task ownership
Verification evidence
Store & SKU trends
✓
Key takeaway:
OSA technology is valuable when it turns a shelf gap from a
reported problem into a
traceable corrective workflow.
Key Takeaways
OSA measures shopper-accessible product availability, not simply inventory in the store.
The OSA formula is simple; defining the expected SKU denominator is harder.
A shelf OOS can occur even when inventory exists in the backroom.
An empty shelf is an observation, not a root cause.
Diagnose OSA through Supply → Inventory → Backroom → Shelf Execution → Shopper Availability.
Do not use a universal OSA benchmark without considering category, SKU velocity, store format, replenishment and economics.
Track OSA at SKU level, not only as a store-wide average.
Measure frequency, duration and recurrence, not just whether a gap occurred.
Analyze OSA alongside planogram compliance, facings and shelf execution.
The strongest OSA programs close the loop: Detect → Diagnose → Assign → Correct → Verify → Prevent.
Technology adds value when it turns shelf observations into evidence-backed, accountable corrective workflows.
Ultimately, improving OSA is not about keeping more inventory everywhere. It is about making sure the right product reaches the right shelf, at the right time, and remains available to the shopper when the purchase decision happens.
Shelf Execution
Keep Every Shelf On Standard
Connect shelf standards, store tasks and execution verification to improve product positioning, availability and compliance across locations.
Define the correct product placement, sequence and facings.
02
Availability
Keep required products visible, available and replenished.
03
Audit
Check the shelf against the approved execution standard.
04
Verify
Identify gaps, capture proof and drive corrective action.
From shelf standards to verified store-level execution.
ABOUT THE AUTHOR
Sharjeel Ahmed
As someone who has built highly scalable products from the ground up, I've always been drawn to solving challenging problems. But it's the quest for operational excellence that truly lights my fire. The thrill of streamlining processes, optimizing efficiency, and bringing out the best in a business – that's what gets me out of bed in the morning. Whether I'm knee-deep in programming or strategizing solutions, my focus is on creating a ripple effect of excellence that transforms not just businesses, but the industry at large. Ready to join forces and raise the bar for operational excellence? Let's connect and make retail operations and Facilities Management better, together.
Enjoyed this read?
Stay up to date with the latest video business news, strategies, and insights sent straight to your inbox!
Thank you! Your submission has been received!
Oops! Something went wrong while submitting the form.